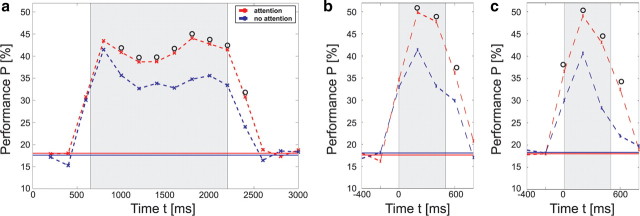
Figure 3.
a, Time course of classification performance for the selected electrode combination above V4 (cf. Fig. 2a, yellow crosses), shown for the attended (red dotted line) and for the nonattended condition (blue dotted line) in monkey F. Data for the power coefficients in a frequency range between 5 and 200 Hz was taken from a range starting 200 ms before, and ending 200 ms after the times marked with the red and blue crosses, respectively. The black circles indicate a significant difference between the performances in both conditions (p = 0.02), while solid lines depict the chance level for the corresponding condition. In a, the SVMs were trained to classify the initial shape s(T1) presented to the monkeys during the period T1 shaded in light gray. Time t is measured relative to trial onset. In b and c, the SVMs were trained to classify the second-to-last and the last shape (target) displayed in the sequence, respectively (stimulus display periods are again shaded in light gray). Time t is measured relative to the onset of the second-to-last shape in b, and relative to the onset of the target shape in c.

