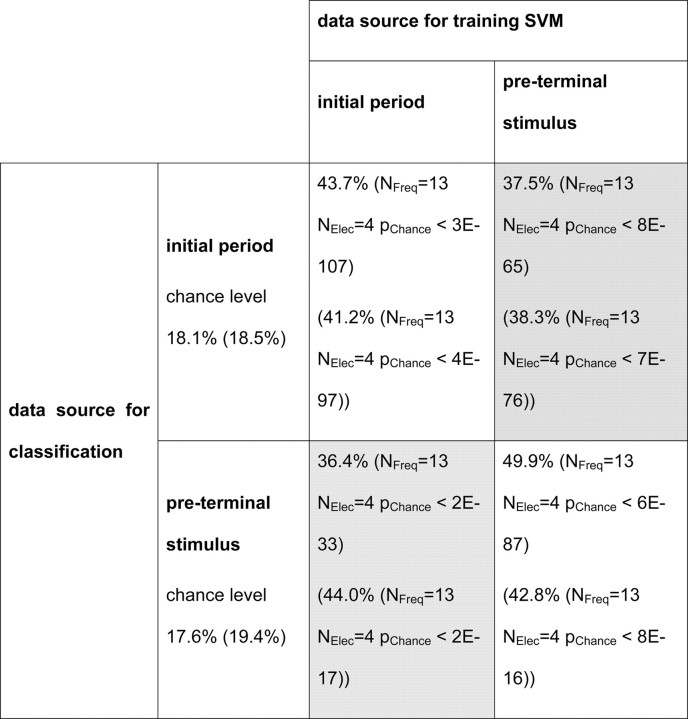
Table 1.
Similarity of stimulus-specific activity patterns supporting classification along trials
The table shows classification performance for data from the period for which the SVM was trained, compared with classification performance on data from a different period (shaded in grey) obtained from the selected V4 electrode combination (a-C, monkey F). Corresponding values for monkey M (a-C) are shown in parentheses.

