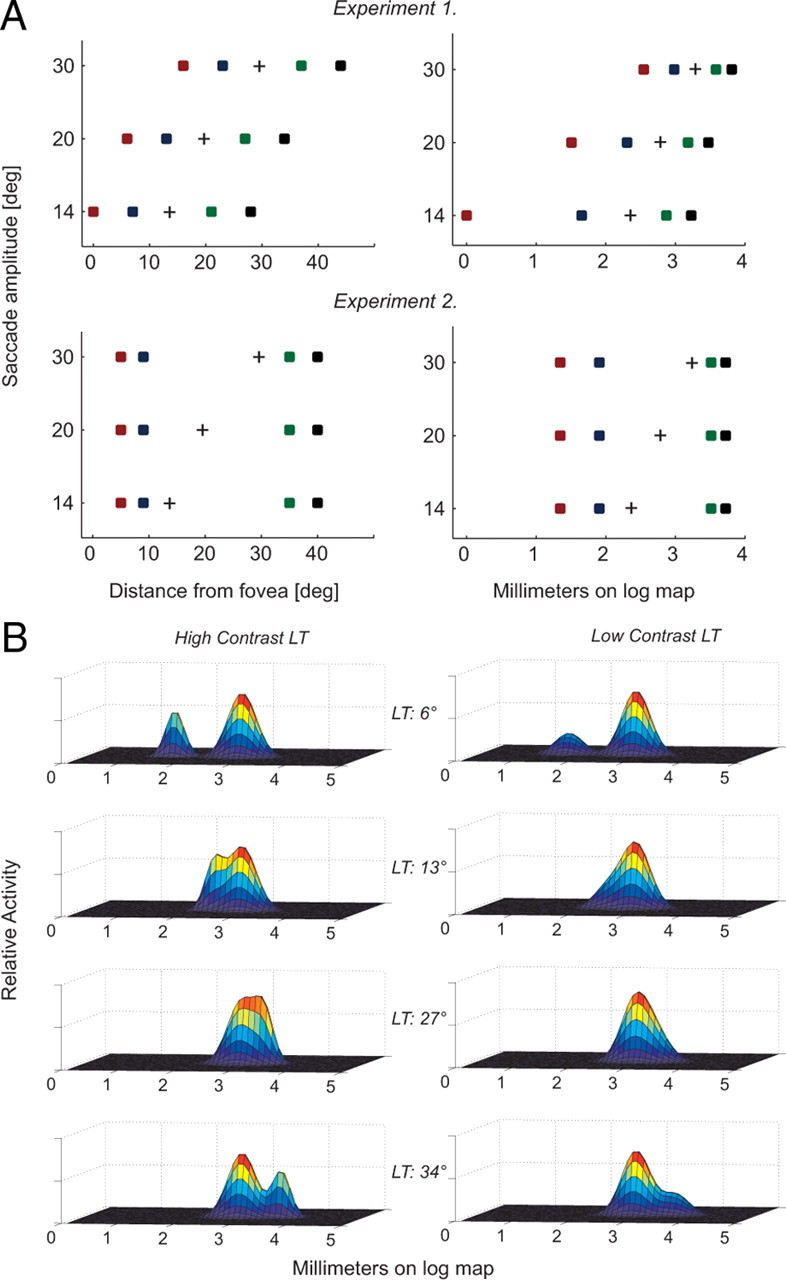
Figure 2.

A, Stimulus positions transformed from visual coordinates to logarithmic coordinates. The left column represents stimulus geometry for experiments 1 and 2 in visual space, whereas the right column shows how the same stimulus configuration would be represented on logarithmic maps in areas such as V1. B, A schematic of how the neural activity attributable to the LT and gaze command to the ST might look if both were represented in a common reference frame, for a 20° saccade in experiment 1 (LT positions 6, 13, 27, and 34°). For each diagram, the smaller hill represents the neural activity attributable to the LT, which can vary in amplitude (or firing frequency) depending on the luminance.
