Figure 4.
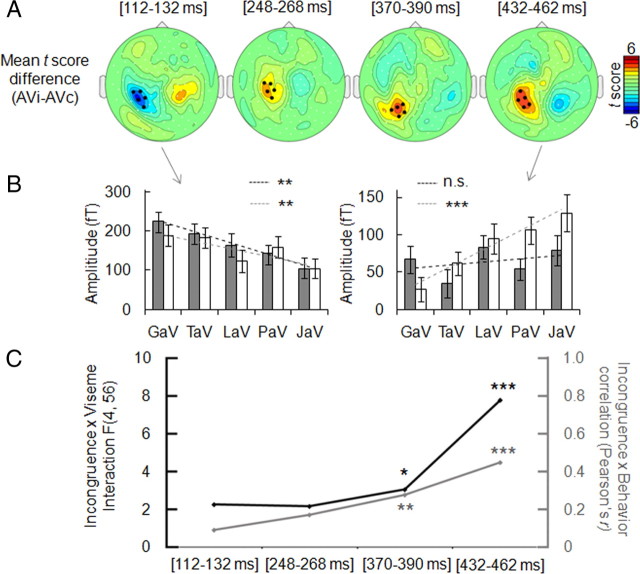
Effect of incongruence on ERFs across time. A, Scalp topographies within the four time windows in which neural incongruence effect was detected (paired t test; grand average of AVi vs AVc conditions, with the overall sum of stimuli in AVi and AVc conditions physically the same) (supplemental Fig. 1A, available at www.jneurosci.org as supplemental material). B, Effect of incongruence on viseme dependency of neural response amplitude, tested across those five selected sensors (black dots on topographies) showing a maximal effect, within the two extreme time windows. Dark and light gray dashed lines represent the correlations between amplitude and predictability in AVc and AVi conditions respectively. C, Parallel between neural responses and behavioral reports related to incongruence. Left axis (dark line) indicates incongruence-by-viseme interaction F values (significant for the last 2 time windows) at the ERF level. The gray line shows that correlation values (Pearson's r, right axis) between ERF amplitude differences and perceived incongruence difference for each AVi versus AVc pair also increases over time. Error bars indicate SEM. n.s., Nonsignificant effect. *p < 0.05, ***p < 0.001.

