Figure 6.
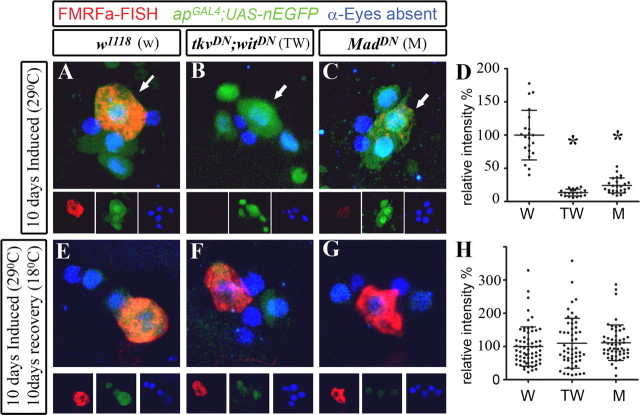
FMRFa transcript was fully restored after recovery from acute BMP blockade in adults. Genotypes were as follows: w1118 control flies (A, E) (apGAL4/+; tub-GAL80TS,UAS-nEGFP/+); tkvDN;witDN flies (B, F) (apGAL4/UAS-tkvDN; tub-GAL80TS, UAS-nEGFP/UAS-witDN); MadDN flies (C, G) (apGAL4/UAS-MadDN; tub-GAL80TS, UAS-nEGFP/UAS-MadDN). Flies were raised at 18°C until A1. They were then switched to 29°C to induce GAL4 activity for 10 d (A–D), or switched to 29°C for 10 d to induce GAL4 activity (E–H), and then returned to 18°C for 10 d to allow neurons to recover from BMP blockade. D, H, Scatter plots show relative pixel intensity of FMRFa FISH in individual Tv neurons of w1118 control (w), tkvDN;witDN flies (TW), or MadDN flies (M). FMRFa FISH intensity was expressed as a percentage of the mean of the control for each experiment. Mean ± SEM is shown. For details, see supplemental Table 1 (available at www.jneurosci.org as supplemental material). A–C, Induction of BMP blockade in adult Tv cluster neurons (blue; anti-Eyes absent) for 10 d reduced FMRFa transcript (red) in Tv neurons (arrow). High nEGFP (green) expression showed GAL4 activity. D, Scatter plot shows that BMP blockade in tkvDN;witDN flies (TW) and MadDN flies (M) significantly reduced FMRFa expression in all Tv neurons, when compared with w1118 control flies (w). Note that these data are included in Figure 4 H for the 10 d time point. *p < 0.0001 compared with w1118 control. E–G, After 10 d of recovery from BMP blockade, FMRFa FISH (red) was fully restored to control levels. Note low-level nEGFP expression (green), indicative of nEGFP expression during the induction period. H, Scatter plot shows that recovery from BMP blockade resulted in a complete restoration of FMRFa FISH levels, with no significant difference seen between w1118 control flies (w), tkvDN;witDN flies (TW), or MadDN flies (M).

