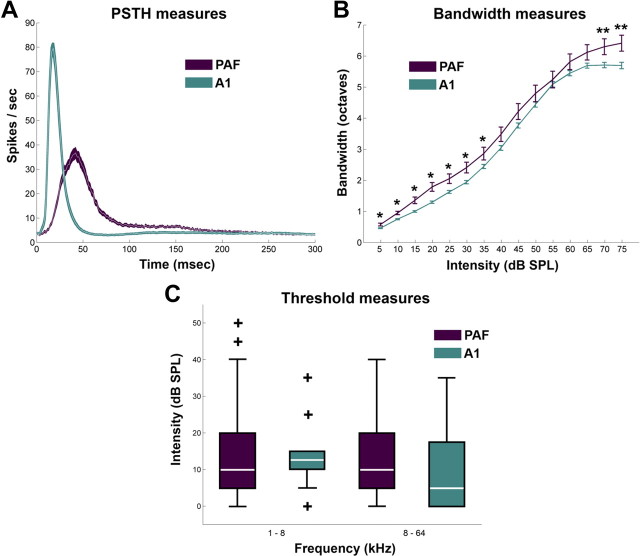
Figure 2.
Response properties of A1 and PAF neurons. A, Population PSTHs of 840 A1 and 268 PAF multiunit sites. B, Mean receptive field bandwidths calculated at each of 15 intensities (in decibels SPL) presented above neuronal threshold from seven A1 and four PAF cortices. C, Neuronal threshold measures of A1 and PAF neurons. Color region (purple and green) in A and error bars in B represent ±SEM. The lines in the box plots of C illustrate the lower quartile, median, and upper quartile values. The whiskers from each end of the boxes show the extent of the rest of the data, and outliers are shown with plus (+) signs beyond the ends of the whiskers. In B, *p < 0.01; **p < 0.05.

