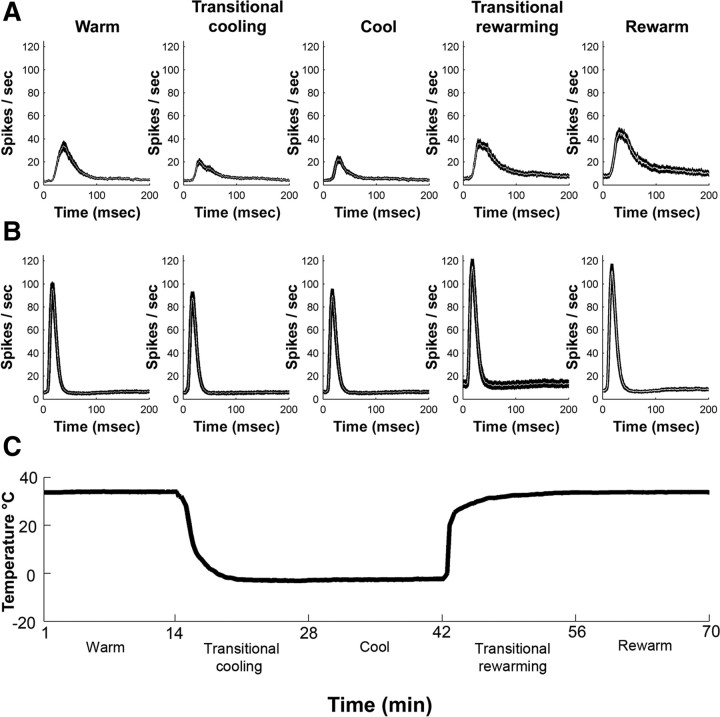
Figure 5.
A, PAF neuronal activity during the five stages of A1 cooling deactivation. B, A1 neuronal activity during the five stages of PAF cooling deactivation. C, Average temperature changes recorded at the cooling loop during A1 and PAF deactivation. The graphs in A and B match the times during which the PSTHs were recorded, as illustrated in C. Note the substantial decrease in PAF activity during A1 deactivation compared with the neuronal activity recorded during the warm and rewarm A1 conditions. Also, note that the activity of A1 neurons recorded before and during PAF cooling deactivation did not significantly differ. The black regions in A and B represent ±SEM.

