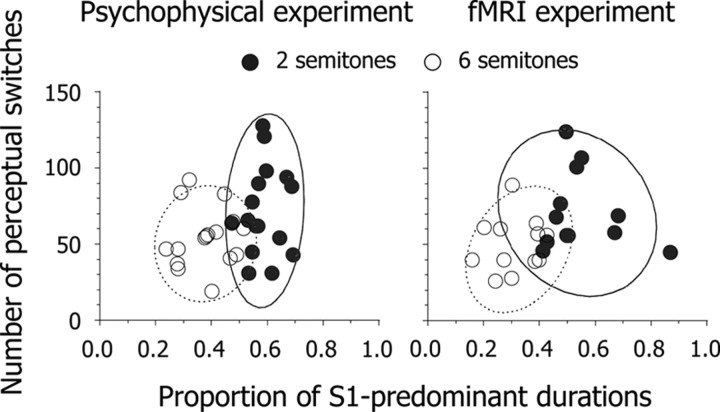
Figure 2.
Scatter plots of the number of perceptual switches within five 90 s runs as a function of the proportion of S1-predominant durations. Circles indicate individual data derived from psychophysical (N = 32) and fMRI (N = 24) experiments. Solid and dashed curved lines represent probability ellipses (90% confidence intervals) based on Mahalanobis distances at Δf ≈ 2 and 6 semitones, respectively.

