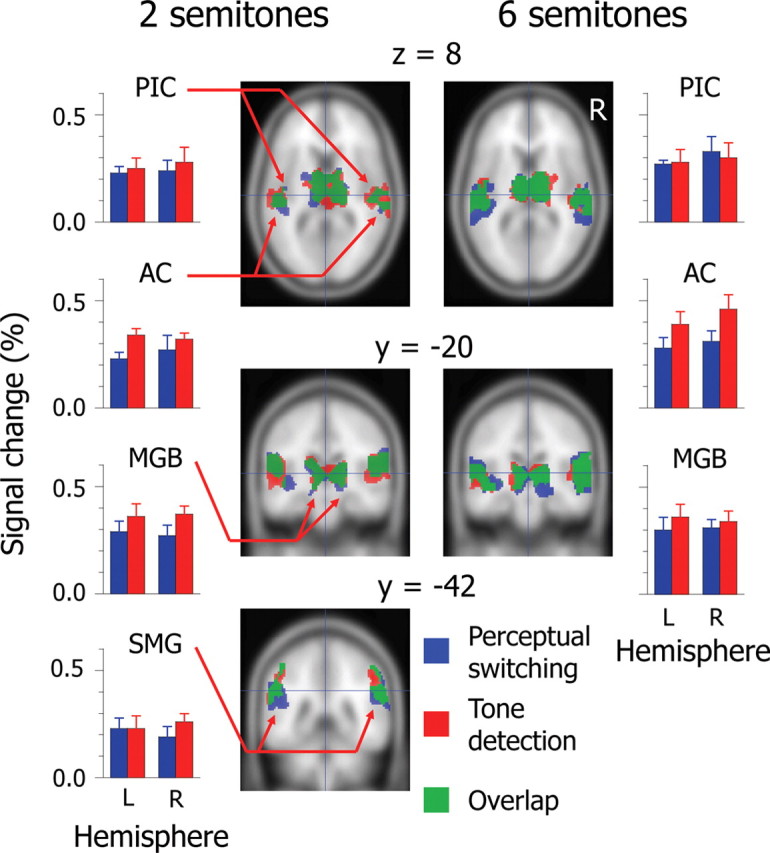
Figure 3.

Extent and intensity of averaged activations for perceptual switching and tone detection (n = 12 for each Δf condition). Colored areas on the coronal and horizontal planes of the standard brain indicate significant activations (FDR <0.05). Hairlines in top/middle and bottom panels target the coordinates (x, y, z) = (0, −20, 8) and (0, −42, 30), respectively. The amplitudes of signal changes are derived from responses of local maxima in activated brain areas. See Table 1 for the locations of local maxima. Error bars represent the SEM. PIC, Posterior insular cortex; AC, auditory cortex; MGB, medial geniculate body; SMG, supramarginal gyrus; L, left; R, right.
