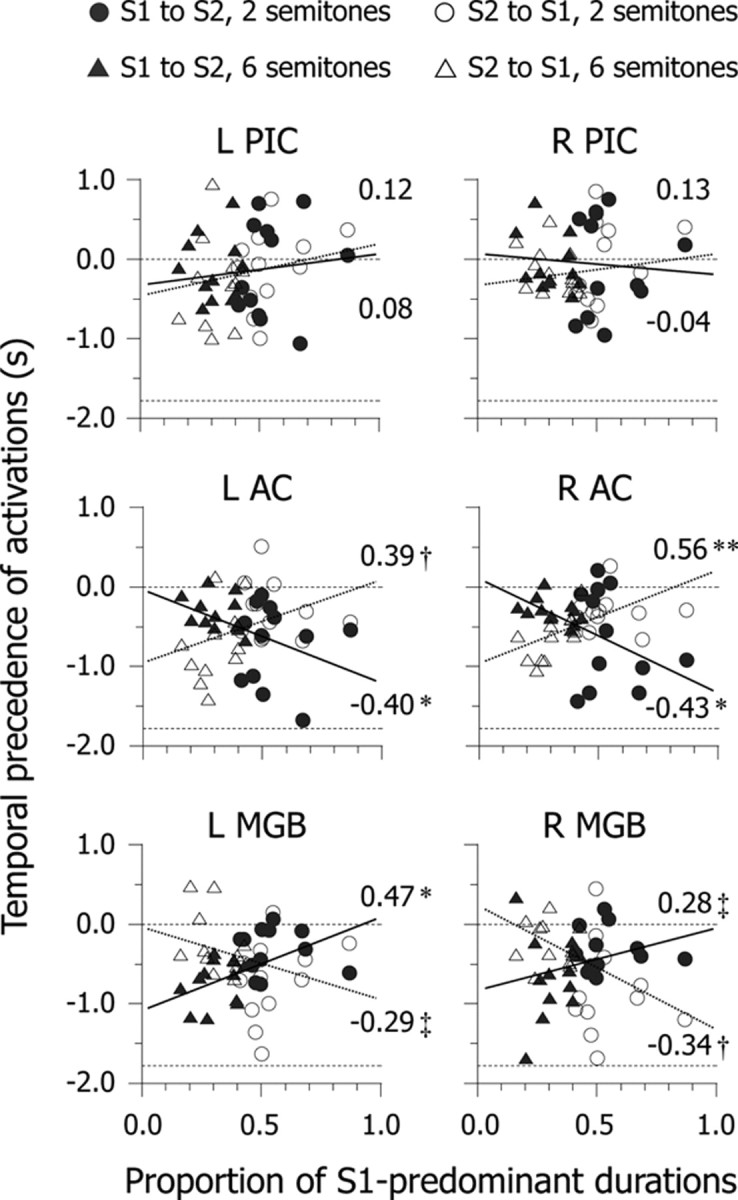
Figure 5.

Scatter plots of temporal precedence of brain activity as a function of the proportion of S1-predominant durations. Circles and triangles indicate individual data (N = 24 for each). Values on the ordinate axis indicate the difference in latency to the peak between an observed response and canonical hemodynamic response. Dashed lines at 0 s and −1.78 s of temporal precedence represent the equality of the canonical hemodynamic response and the lower (i.e., earlier) limitation of range, respectively. Solid and dotted lines are regression lines corresponding to perceptual switching from S1 to S2 and in the opposite direction, respectively. Values in each panel represent brain–behavior correlation coefficients. See the legends of Figures 1 and 3 for abbreviations. **p < 0.01, *p < 0.05, †p < 0.10, ‡p < 0.20.
