
Figure 6.
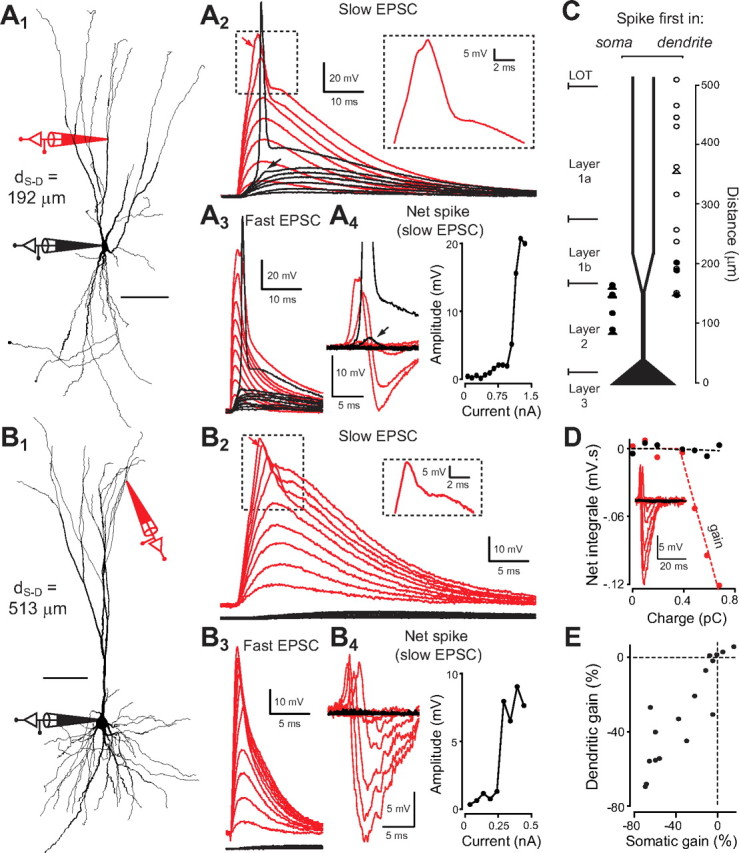
Generation of small local dendritic spikes. A1, Reconstruction of a PC pyramidal cell with the locations of somatic and dendritic (d S-D = 192 μm from soma) recordings shown schematically. A2, Voltage at soma and dendrite resulting from increasing EPSC-like injections in the dendrite. Large dendritic depolarizations generate a fast sodium spike (see magnification in the inset of the spike indicated by the upper arrow). The lower arrow shows the effect of the dendritic spike when it failed to trigger an AP in the axon hillock. A3, Same as A2 but for a faster EPSC. A4, Left, Traces of net spikes in the soma and dendrite (actual voltage minus voltage predicted from subthreshold EPSPs) for A 2. Right, Net spike amplitude versus injected current amplitude for A2. B, Same as A for a more distal recording (d S-D = 513 μm from soma). In this case, it was not possible to trigger a somatic AP. C, Plot showing whether a spike was initiated first in the dendrite (right) or in the soma (left) for an increasing current injection at the dendrite. Circles indicate pyramidal cells and triangles semilunar cells. Empty markers indicate when no somatic spike could be triggered. D, Integral of the total net spike (as showed in the inset), at the soma (black) and at the dendrite (red), plotted as a function of injected charge for the example shown in B. The red and black dashed lines represents fits of the data with a piecewise linear function (f(x) = 0 if x < x 0 and f(x) = α(x − x 0) if x ≥ x 0). The fitted parameters α and x 0 are, respectively, the voltage gain and the current threshold for dendritic spikes. E, Voltage gains (fitted α expressed in percentage of the dendritic input resistance) in soma and dendrite for all observed dendritic spikes (n = 15).