
Figure 1.
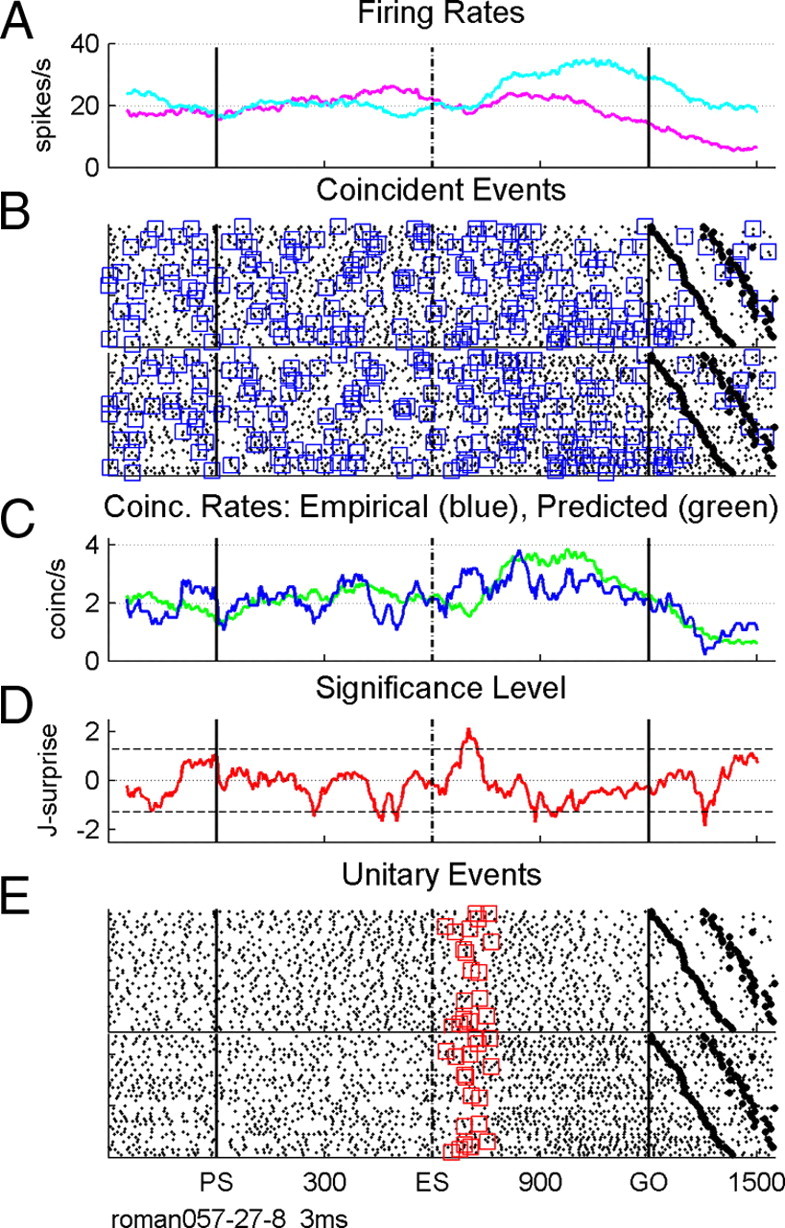
Precise spike synchrony between two simultaneously recorded neurons. A, Firing rate profiles of the two neurons averaged across trials. B, Raster displays and synchronous spikes detected with a precision of 3 ms (blue squares). First range of black large dots after go indicate movement onset, and the second range indicates the end of movement. Trials were arranged according to increasing reaction times from top to bottom. C, Empirical (blue) and predicted (green) coincidence rates. D, Time-resolved statistical significance expressed by the joint-surprise measure. The horizontal dashed lines correspond to a statistical significance of p = 0.05. E, Unitary events (red squares). Time is in milliseconds, starting at PS.