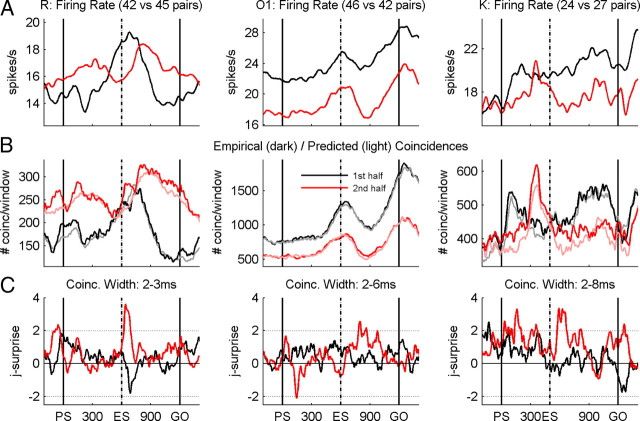
Figure 8.
Same analysis as in Figure 7 for all three monkeys (R, O1, and K, left, middle, and right columns, respectively) showing the average firing rates (A), the total counts of empirical and predicted coincidences (B), and the synchrony (C) expressed by the joint-surprise. For monkey R, synchrony was analyzed for coincidence widths between 2 and 3 ms, for monkey O1 between 2 and 6 ms, and for monkey K between 2 and 8 ms. Black lines, First half of recording sessions; red lines, second half of sessions.

