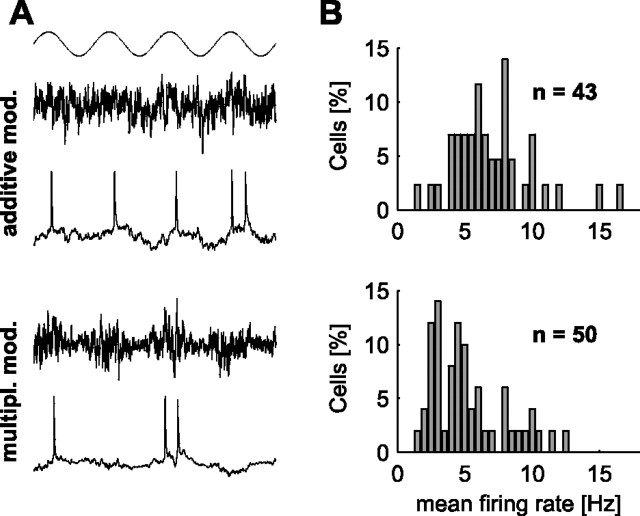
Figure 1.
A, Stimulation paradigms used in the present study. The top trace shows the phase of the sine wave, with which the injected noisy currents were modulated. Below, Examples of injected currents (top traces) and resulting membrane potential fluctuations (bottom traces) are shown for both additive and multiplicative modulation. B, Histograms of average firing rates for all cells used for the additive (top) and multiplicative (bottom) modulation.

