
Figure 5.
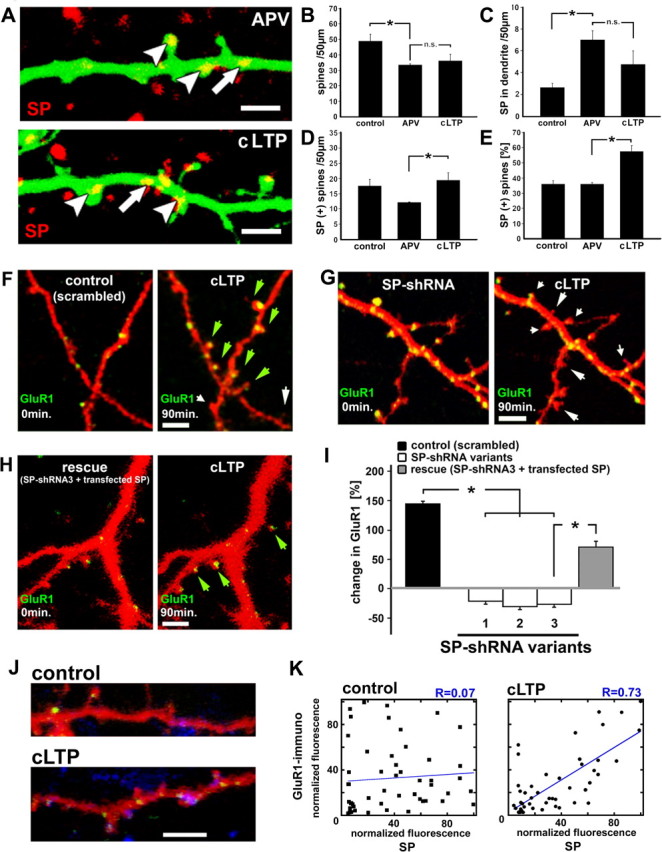
SP shRNA-transfected neurons demonstrate reduced accumulation of GluR1-clusters in spine heads after the induction of LTP. A–E, A transient activation of synaptic NMDA-Rs (cLTP) causes an increase in the number of SP(+) spines within 90 min (untreated controls: n = 4 cultures, 16 segments, 778 spines; APV: n = 4 cultures, 16 segments, 531 spines; cLTP: n = 3 cultures, 12 segments, 353 spines). Arrowheads point at SP(+) spines, and the arrows highlight endogenous SP in the dendrite. Scale bar, 2 μm. B–E, In APV-treated cultures, a decrease in spine density (B; p < 0.001) is accompanied by more SP puncta located in the dendrite compared with control cultures (C; p < 0.001). LTP causes a significant increase in the number of SP(+) spines (D, E; p < 0.04), although changes in spine density are negligible (B; p > 0.31). SP in the dendrite is not reduced back to control levels after the induction of LTP (C). F–I, Effects of cLTP on dendritic spines and GluR1 clusters are illustrated for neurons transfected with (F) a scrambled control vector, (G) shRNA for SP, and (H) with a 3′UTR-shRNA and SP (for rescue), before (left) and 90 min after (right) cLTP induction (GFP-GluR1 is yellow when colocalized with DsRed). Green arrows indicate the formation of new spines with a GluR1 cluster, white arrows indicate shrinkage or disappearance of spines, and short arrows indicate disappearance of GluR1 clusters. Scale bars, 2 μm. I, Changes in fluorescence intensity of GFP-GluR1 clusters in individual spine heads were measured in four control neurons (transfected with the scrambled plasmid), in 15 shRNA-transfected neurons (n = 5 cells per group), and in 4 neurons transfected with 3′UTR-shRNA and SP (one cell per glass). There was a marked increase in GluR1 fluorescence after the conditioning protocol. In contrast, the shRNA-transfected neurons demonstrated a decrease in GluR1 fluorescence 90 min after cLTP induction. Remarkably, in the group of neurons transfected with 3′UTR-shRNA and SP, GluR1 fluorescence was back to scrambled control levels, which were significantly different from the levels in shRNA-transfected cells. J, Colocalization of SP-transfected (green) and GluR1-immunoreactive (blue) dendrites in control (top) and LTP-treated culture (bottom). Scale bar, 3 μm. K, Summary of quantification of colocalized GluR1-immunoreactive and SP-fluorescent puncta in control (n = 5 cells, 50 spines) and cLTP-treated neurons (n = 6 cells, 50 spines), demonstrating the lack of correlation in the control, and a highly significant (r = 0.73, p < 0.01) correlation between SP fluorescence and GluR1.