
Figure 1.
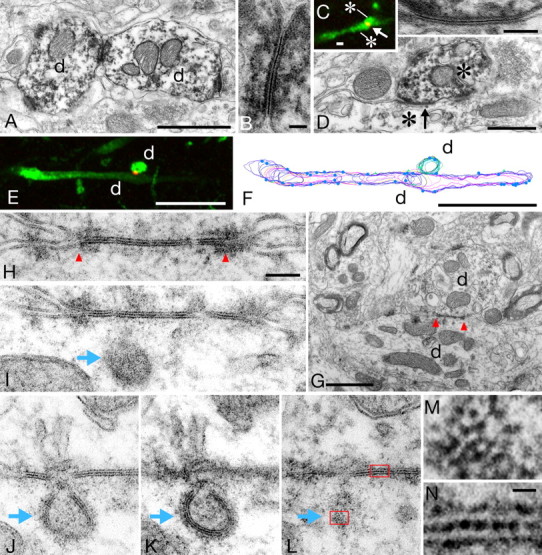
Identification of neuronal gap junctions in the striatum. A, Two PV-immunoreactive dendrites (d) make direct contact with each other. B, Enlargement of the contact site in A, demonstrating a typical ultrastructure of gap junction. C, Dual CLSM image showing Cx36 (red)-immunoreactive punctuate structure located at the contact site (arrow) between two PV (green)-immunoreactive dendrites (asterisks), one running horizontally while the other perpendicular to the image. D, The same contact site shown in C was re-examined in EM by converting fluorescent signals for PV to DAB reaction products. High-power view (inset) indicates strict correspondence of Cx36 labeling in CLSM to gap junction in EM. E–L, Functional and dynamic aspects of gap junctional coupling. After taking dual CLSM image (PV green; Cx36 red), the same contacting dendrites (d) were identified by EM (G), reconstructed from serial ultrathin sections (F), and confirmed to form gap junction between them (H). Blue dots on the surface of reconstructed dendrites in F indicate sites of synaptic contacts. Red arrowheads in G and H demarcate gap junction. Serial ultrathin sections (I–L) next to H demonstrate a presumed internalization of gap junction (blue arrows). Images in J and K are taken from the same specimen with different tilt angles for EM observations. Coated pits are visible around the internalized membranes in K. M, Enlargement of the framed area (bottom) in L. Note hexagonal array of spot-like reaction products. N, Enlargement of the framed area (top) in L, showing an alternating pattern of reaction products along the central line of the gap junction. Scale bars: A, C, G, 1 μm; B, 50 nm; D, 0.5 μm; inset, 100 nm; E, F, 10 μm; H-L, 100 nm; M, N, 10 nm.