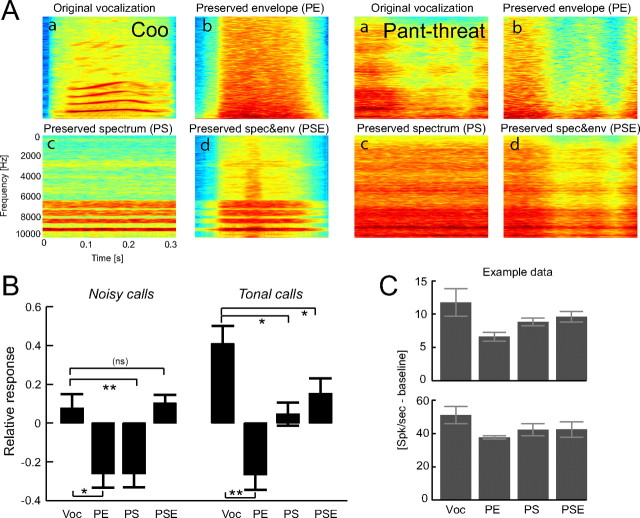
Figure 5.
Insula responses to acoustical control stimuli. A, Top, The time–frequency representations of two vocalizations (coo and threat). The other panels display the time–frequency representations of the acoustical control stimuli obtained from the spectra and envelopes of these sounds (see Materials and Methods, Acoustical stimuli, for a description). Note that the PSE has the same average spectrum and envelope as the original vocalization but does not preserve their interaction. This is especially visible for the coo. B, Relative response amplitude of insula units to the original vocalizations and the acoustic controlled sounds, shown separately for tonal and noisy calls. Asterisks indicate significant differences (paired t tests, *p < 0.01,**p < 0.001). C, Two examples of the response amplitude of insula units to the acoustic control sounds, reflecting the population result of B.

