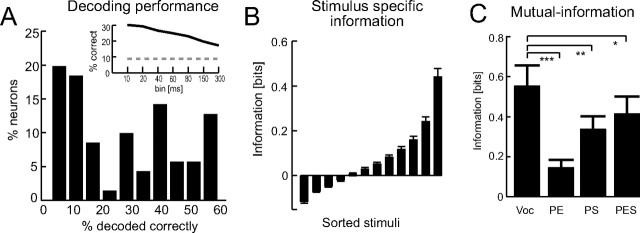
Figure 6.
Selectivity of insula neurons to individual vocalizations. A, Results of a decoding analysis showing the percentage of calls correctly decoded from single trial responses. Decoding was most accurate when the response was sampled using short time bins (<20 ms). Dotted line indicates chance level. B, Stimulus specific information. For each neuron, we computed the information in its response for each of 12 vocalizations. The bar graph displays the mean (and SEM) information after sorting the vocalizations for each neuron according to their information value. Insula neurons are highly informative to only a few vocalizations. Information values have been corrected for statistical bias using a bootstrapping procedure, and small (negative) fluctuations around zero represent negligible information content. C, Mutual (Shannon) information between stimulus set and response for the original vocalizations and the acoustic controls. Bars indicate the mean and SEM across insula neurons. Asterisks indicate significant differences (paired t tests, *p < 0.05,**p < 10−3, ***p < 10−7).

