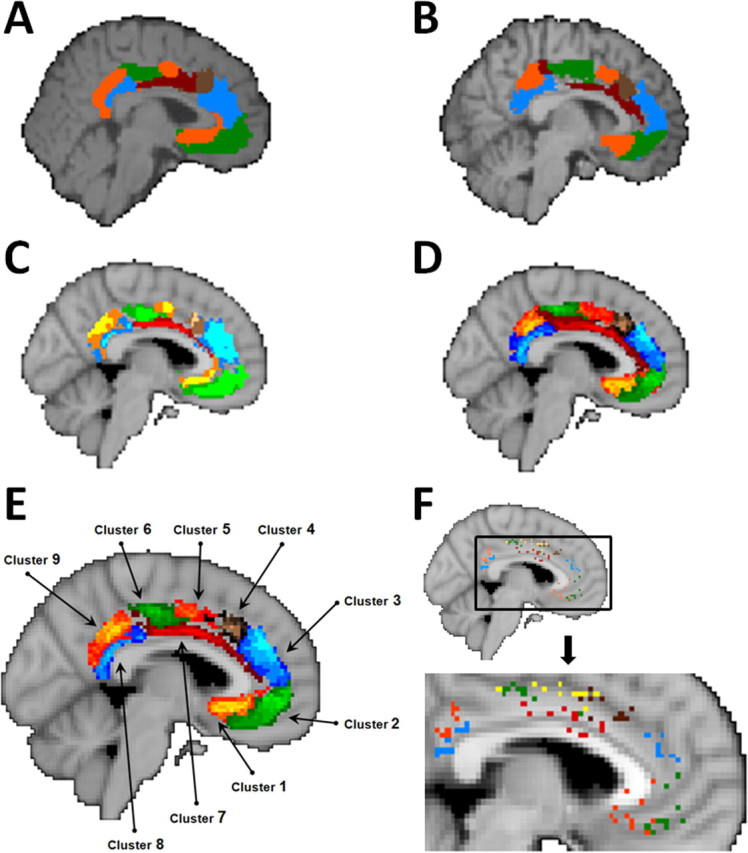
Figure 3.

Connectivity-based parcellation of human cingulate cortex. The parcellation analysis resulted in the reliable detection of nine clusters in similar positions in all subjects. The position of the nine clusters in an example subject who lacked a clearly defined paracingulate sulcus (A) and in a subject with an identifiable paracingulate sulcus (B). Average maps were constructed for the group of subjects (n = 3) without clearly identifiable paracingulate sulci (C) and the group (n = 8) with identifiable paracingulate sulci (D). Clusters are identified on group maps wherever there is an overlap in their positions in more than two subjects (for the group of 3 subjects without paracingulate sulci; C) or more than five subjects (for the group of 8 subjects with paracingulate sulci; D). Clusters can be seen in approximately similar positions in the two groups of subjects. E, The average positions of the clusters (6 subject threshold overlap) for the entire group of 11 subjects is also shown. F, The variability in cluster position across individuals can be visualized by plotting the center of gravity of each cluster in each individual on the same image. Points of the same color refer to the centers of gravity of a given cluster in each subject. Occasionally, the center of gravity of a given cluster was the same in two subjects, and only a single point is plotted to represent both subjects. The centers of gravity of different clusters never overlapped in different subjects. Some of the centers of gravity were placed on the corpus callosum, although the clusters themselves did not overlap with the corpus callosum. All MRI scans are sagittal sections [x = −4, MNI coordinate system (Collins et al., 1994)]. Individual subject data are shown on the same individuals' structural MRI scans. All group data are shown on the MNI standard brain.
