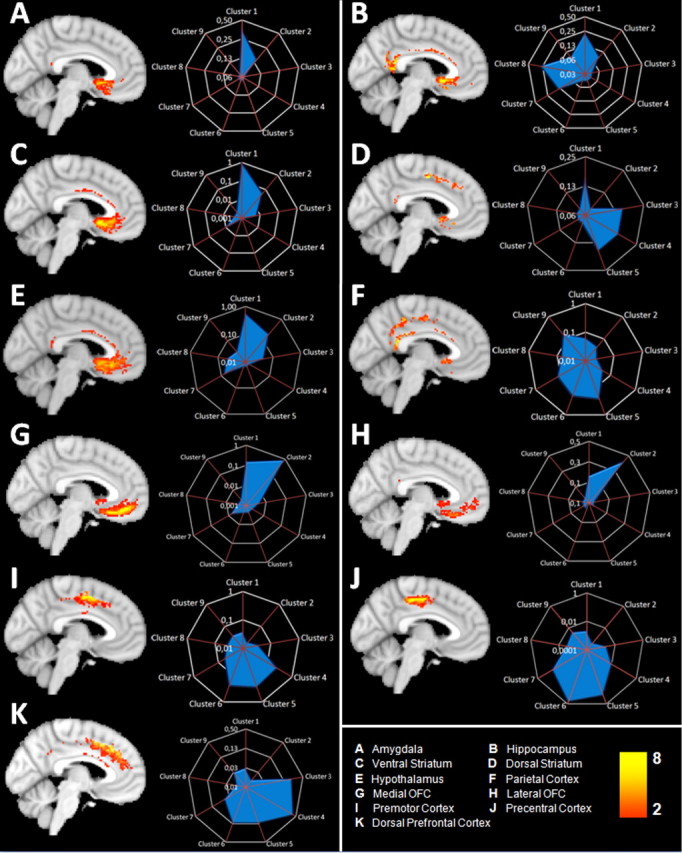
Figure 5.

A, Group overlay of voxels with a high probability of interconnection with the amygdala, thresholded at no less than two subjects (thus excluding voxels that had survived initial thresholding in a single subject only). Note, however, that yellow voxels are ones in which connections to a given area were found in eight or more subjects. Amygdala connectivity fingerprint showing the relative connection probability between the amygdala and the nine cingulate/medial frontal clusters. The highest amygdala connection probabilities were with clusters 1, 2, and 7. Note that the connectivity fingerprint gives a threshold-free indication of the average strength (across all subjects) of connection between each cingulate/medial frontal cluster and each target region. Regions with a high probability of interconnection and connectivity fingerprints are shown for the hippocampus (B), ventral striatum (C), dorsal striatum (D), hypothalamus (E), parietal cortex (F), medial orbitofrontal cortex (G), lateral orbitofrontal cortex (H), premotor cortex (I), precentral cortex (J), and dorsal prefrontal cortex (K). Note that all fingerprint figures are plotted using a log scale, but that scaling varies.
