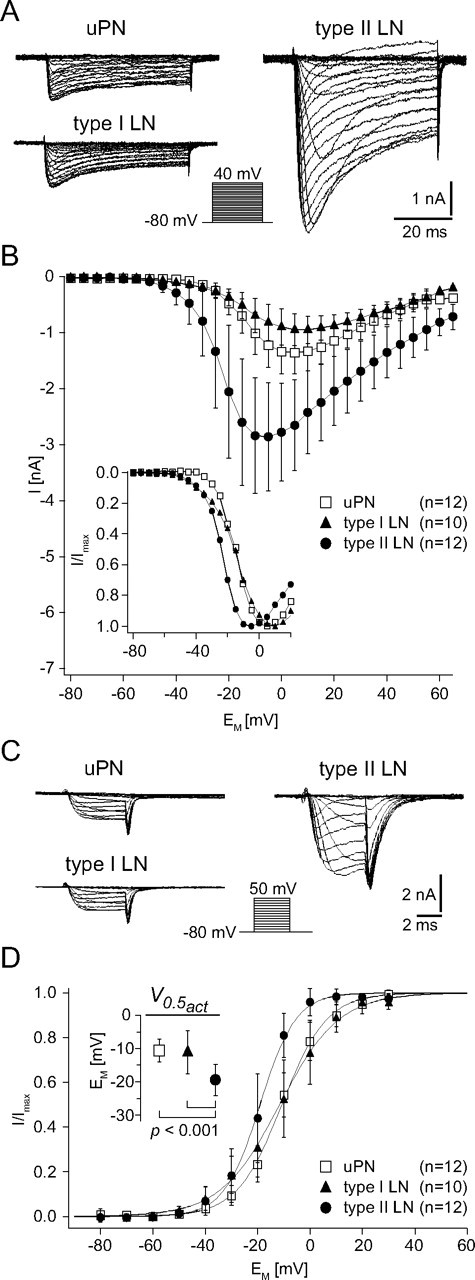
Figure 5.

Characterization of the Ca2+ currents (ICa) from uPNs, type I LNs, and type II LNs. A, Example current traces for steady-state activation of ICa from a uPN, a type I LN, and a type II LN. The holding potential was −80 mV and neurons were depolarized for 50 ms to at least 40 mV in 5 mV increments. Note that the current amplitude is much larger in the type II LN than in the uPN and type I LN. B, I–V relationships of ICa recorded from uPNs, type I LNs, and type II LNs. The inset shows the normalized I–V relationships to better demonstrate differences in the voltage dependence (for a quantitative comparison, see D, inset). In uPNs, the peak current reached its maximum amplitude (Imax) of 1.4 ± 0.4 nA at 5.8 ± 4.9 mV (n = 12). In type I LNs, the Imax of 1.0 ± 0.3 nA was reached at 9.0 ± 6.1 mV (n = 10), and in type II LNs, the Imax of 3.0 ± 1.0 nA was reached at −7.5 ± 7.2 mV (n = 12). C, Example current traces for steady-state activation of tail currents (ICa,tail) from a uPN, a type I LN, and a type II LN. The holding potential was −80 mV, and neurons were depolarized for 5 ms to 50 mV in 10 mV increments. D, I–V relationships of normalized tail currents. Before averaging, the tail currents were normalized to the maximum tail current of each cell. Curves are fits to a first-order Boltzmann relationship (Eq. 1) with the following parameters: uPN, V0.5act = −10.6 ± 3.4 mV, sact = 8.5 ± 1.8, n = 12; type I LN, V0.5act = −11.1 ± 6.5 mV, sact = 10.0 ± 2.3, n = 10; type II LN, V0.5act = −19.4 ± 4.7 mV, sact = 6.4 ± 2.3, n = 12. D, Inset, In type II LNs, the voltage for half-maximal activation (V0.5act) was significantly (p < 0.001) more hyperpolarized than in uPNs and in type I LNs, in which the V0.5act was very similar (p = 0.8).
