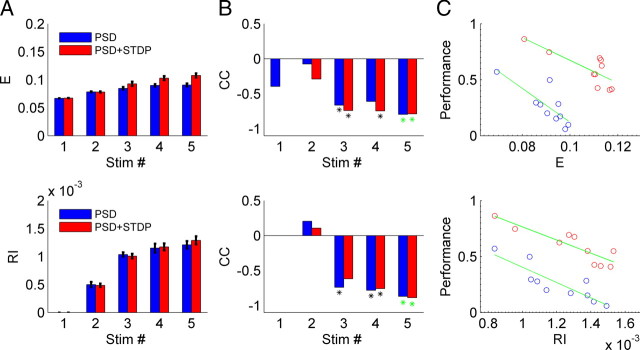
Figure 8.
Network recurrence increases with increasing number of stimuli and is inversely correlated with the performance. A, Both E and RI increase as the number of stimuli used to train the network increases – independently of whether PSD (blue) or PSD+STDP (red) was used. B, Correlation coefficients between E and RI and the performance for a given stimulus number are negative. The asterisk represents a significant correlation (p < 0.05). The green asterisks indicate the data shown in C. C, An example of the data for the correlations shown in B. E (top) or RI (bottom) are plotted against performance for networks trained with five stimuli. The green line represents the linear fit of the 10 points, each of which represents a simulation with different random seeds.

