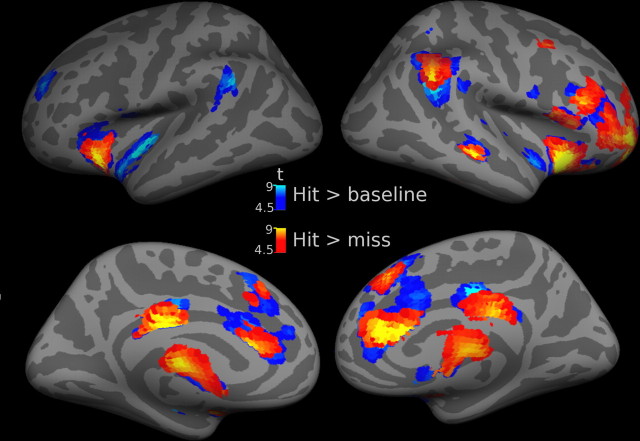
Figure 2.
Spatial distribution of evoked cortical responses during successful stimulus detection. Activations evoked in hit trials versus baseline are shown in cold colors (for details, compare supplemental Table 1, available at www.jneurosci.org as supplemental material). A direct comparison of greater responses during hits than misses (warm colors) revealed a very similar activation pattern. Threshold height p < 0.05 corrected at the cluster level using an auxiliary (uncorrected) voxel threshold of p < 0.0001. Group results (n = 11) are superimposed onto the lateral and medial aspects of an inflated cortical surface of a canonical average brain.

