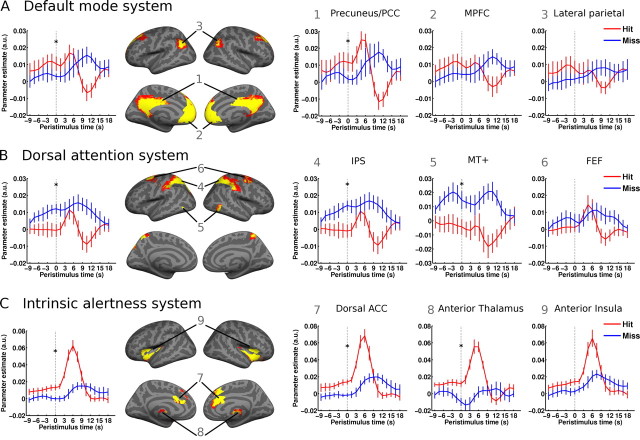
Figure 4.
Prestimulus time courses from resting-state functional connectivity (rs-fc) networks. Left, Time courses averaged over the complete rs-fc systems. Middle, Rs-fc networks as defined by seed-based analysis of a resting-state scanning session. Numbers indicate regions of interest for which peristimulus activity time courses are plotted in the right-hand panels. Right, Time courses of individual regions of the respective network. While higher signal levels in the default mode system (A) and the intrinsic alertness system (C) were found before successful stimulus detection, higher signal in the dorsal attention system (B) preceded misses. Asterisks indicate significant percept-dependent time course difference at time point 0 s. Error bars indicate ±SEM.

