
Figure 4.
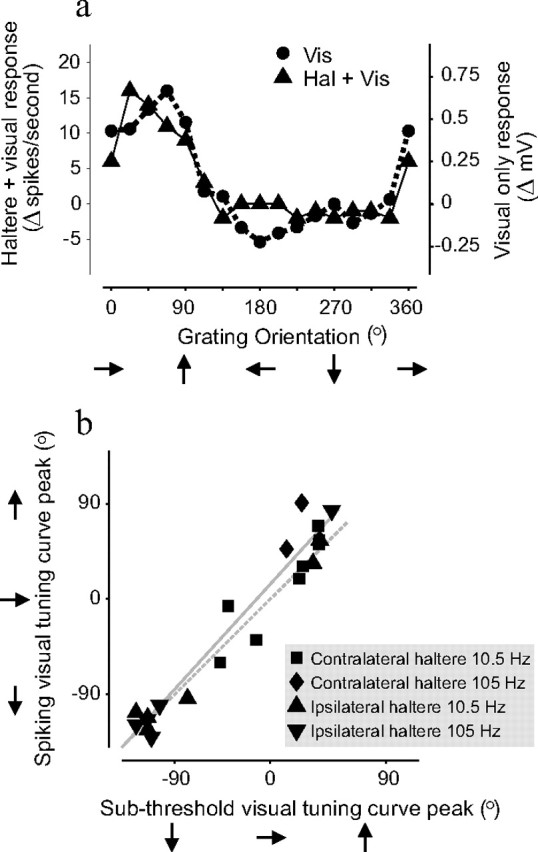
NMNs' subthreshold responses are tuned to the same directions of visual motion as their action potential responses. a, Example of a visual directional tuning curve from a right FN NMN. The circular symbols and dashed line show the average amplitude of the NMN's subthreshold response to different directions of visual motion. The triangular symbols and solid line show the same NMN's action potential response to combined contralateral haltere oscillation and visual motion stimuli. The subthreshold and action potential tuning curves are very similar. b, Correlation between subthreshold and action potential tuning curve peaks for all FN NMNs studied. Subthreshold visual tuning curve peaks are plotted against the peaks of the action potential tuning curves obtained during combined visual and haltere stimulation. Different symbols indicate the frequency of haltere stimulation and which haltere it was applied to in each individual experiment. The data points fall around a line of slope of ≈1, suggesting that for all tested NMNs (n = 21) the subthreshold and action potential visual tunings were virtually identical. The solid gray line shows the result of a linear regression and the dotted gray line shows a line of unity slope and zero intercept.