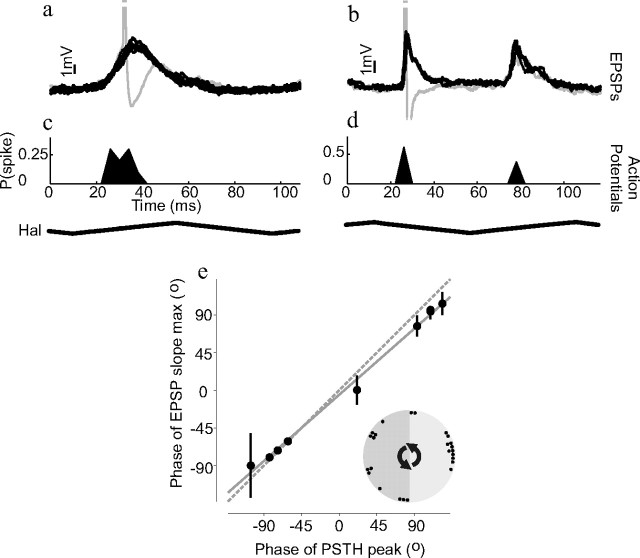
Figure 5.
Visually induced action potentials and haltere-induced PSPs occur at the same phase of haltere movement. a, b, The compound PSPs occurring during one cycle of haltere-only stimulation are overlaid to show their phase locking to the haltere stimulus (haltere stimulus waveform shown below c and d). Clipped action potentials are also shown in gray. a and b are taken from two different example neurons. c, d, Histograms giving the probability of action potentials occurring at different phases of the haltere stimulus cycle during combined visual and haltere stimulation. c and d are taken from the same neurons as a and b, respectively, and were plotted on the same timescale; 4 ms wide bins were used to create the histograms. The compound PSP waveforms obtained during haltere-only stimulation occur at similar phases of the haltere stimulus waveform as the action potentials during combined stimulation. e, The correlation between the timing of action potentials (during combined haltere and vision stimulation) and the timing of the PSPs' maximum slope (during just haltere stimulation). Both PSP and action potential times are plotted relative to the haltere stimulus phase. Each circle represents the mean phase for one neuron; n = 10. Error bars are circular SDs. Some error bars are too small to be visible. The solid gray line is the result of a linear regression and the dotted gray line has unity slope and zero intercept. The circular inset in e shows the mean action potential phases for 25 cells that responded to contralateral haltere stimulation.

