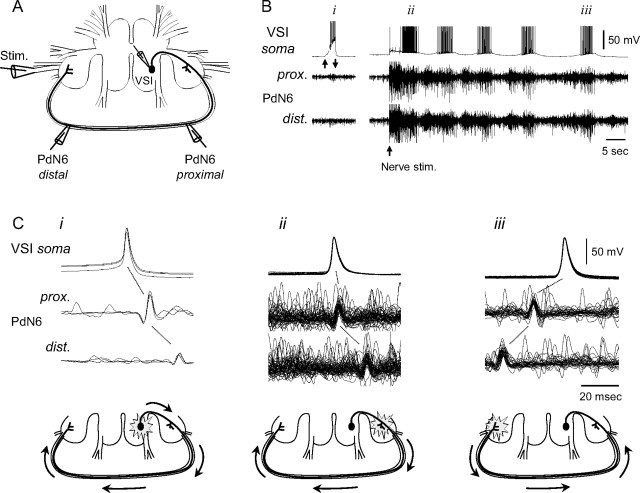
Figure 3.
VSI action potentials initiated in either pedal ganglion during a swim motor pattern. A, A schematic diagram showing the recording and stimulus configuration. Intracellular microelectrodes were placed in the soma of the right VSI, and extracellular recordings were made by en passant suction electrodes placed onto PdN6 at two loci (proximal and distal). The nerve stimulation was given to the left PdN3 via a suction electrode. B, Intracellular activity recorded from VSI and extracellular impulses recorded from two loci of PdN6 when VSI was depolarized by current injection (left) and during the swim motor program (right). Upward and downward arrows under the left VSI soma trace indicate the duration of current injection controlled by hand (0∼2 nA). The upward arrow under the right traces indicates the start time of PdN3 stimulation (8 V, 1 ms pulses at 5 Hz for 3 s). i, ii, and iii indicate bursts used for overlaid spike-triggered traces shown in Ci–iii. C, Overlaid spike-triggered traces show that the location of the spike initiation zone switched during the swim motor pattern of the time periods in B. Schematic drawings under the traces show the presumptive spike initiation zones and the direction of action potential conduction in VSI. Note that there was a slight change in the latency from the somatic action potential with respect to the extracellular spikes. This indicates that the proximal spike initiation zone is closer to the PdN6 recording site during the swim motor pattern (Cii) than when spikes are initiated by current injection into the soma (Ci).

