Figure 5.

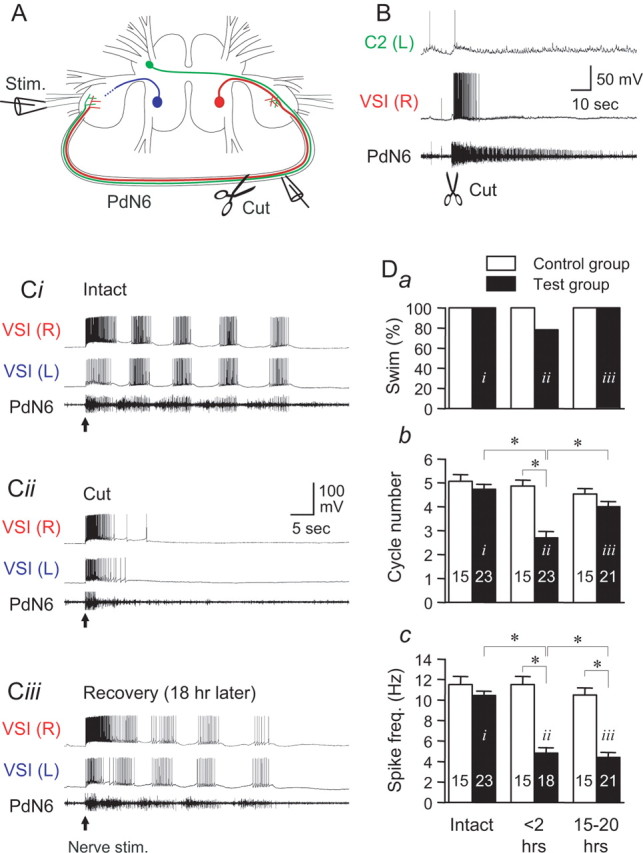
Cutting PdN6 in an isolated brain disrupted the swim motor pattern, which eventually recovered. A, A schematic drawing of the Tritonia brain, showing two VSIs, the location of the extracellular stimulation on the left PdN3, and en passant recording from PdN6. After recording the swim motor pattern, PdN6 was cut as indicated by scissors. B, Cutting PdN6 caused a brief firing of the CPG neurons. An example showing the responses of left C2 and right VSI to cutting PdN6. Immediately after the cut, C2 showed only a single action potential, whereas VSI showed tonic firing lasting for ∼10 s. Injury discharges from unknown axons in PdN6 were observed for ∼1 min after the cut. C, Simultaneous intracellular recording from both VSIs and extracellular recording from PdN6 were made 5 min before cutting PdN6 (Ci), 5 min after cutting PdN6 (Cii), and 18 h after the cut (Ciii). The arrows indicate the time of the nerve stimulation. D, The effect of cutting PdN6 on the following: the percentage of preparations showing more than one burst (a), the number of burst cycles (b), and the intraburst spike frequency (c). In b and c, the averaged number of the burst cycles (b) and the spike frequency in the second burst in the swim motor pattern (c) were plotted in bar graphs with error bars (mean ± SEM). The black bars are from experimental preparations, and the white bars show time-matched controls without the lesion. The data were obtained within 1 h before the cut (intact), within 2 h of the cut (<2 h), and the day after the cut (15–20 h). In each test, the averaged value of up to three swim responses evoked at the intervals of >10 min was measured. The label (i–iii) in each bar corresponds to the example traces shown in Ci–Ciii. The number in each bar shows the number of preparations tested. Each bracket with an asterisk indicates significant difference (Student's t test, p < 0.05; N = 18–23).
