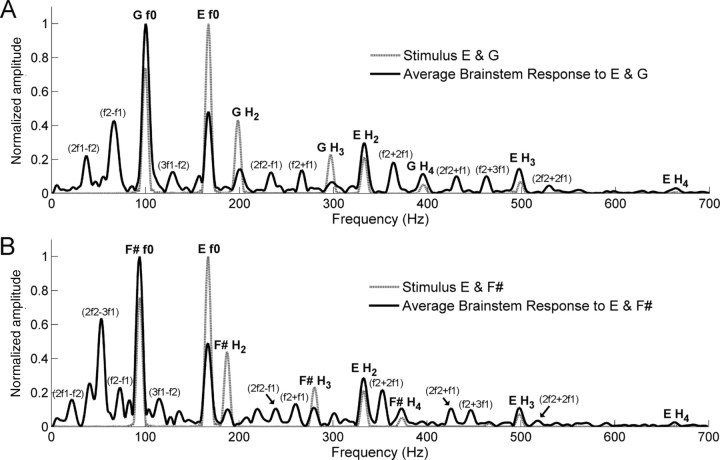
Figure 2.
Stimulus and response spectra for the consonant (A) and the dissonant (B) intervals. The response spectrum displays the average of all 26 subjects. The stimulus and response spectral amplitudes are scaled relative to their respective maximum amplitudes. Parentheses denote combination tones that do not exist in stimuli. f1 denotes the lower tone and f2 denotes the upper tone of each interval. See also Table 1.

