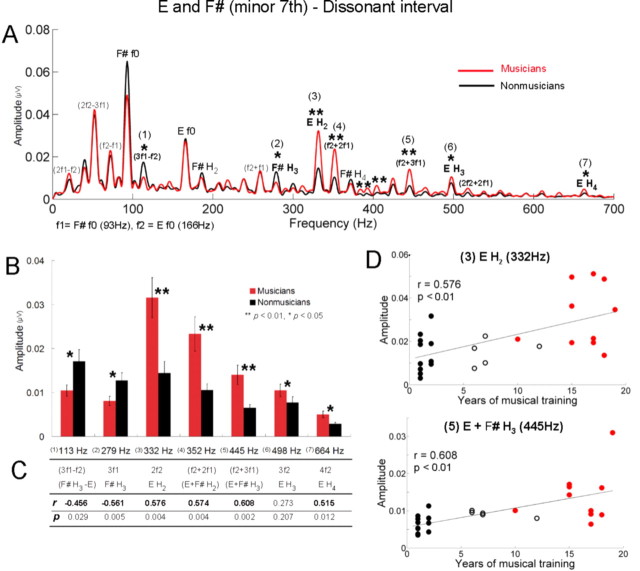
Figure 4.
In the dissonant interval, musicians show heightened responses to the harmonics of the upper tone and sum tones, whereas nonmusicians show enhanced responses to the third harmonic of the lower tone and 3f1 − f2. A, Grand average spectra for musicians (red) and nonmusicians (black) for the dissonant interval. f1 and f2 represent F# and E. B, Amplitudes of frequencies showing significant group differences. Error bars display ±1 SE. C, Pearson's correlations (r and p) between amplitudes and years of musical training. Significant correlations appear in bold. D, Individual amplitudes of the second harmonic of E (top) and f2 + 3f1 (= E f0 + F# H3) (bottom) as a function of years of musical training for all subjects (n = 26) including the amateur group. Filled black circles represent nonmusicians, open black circles represent amateur musicians, and red circles represent musicians.

