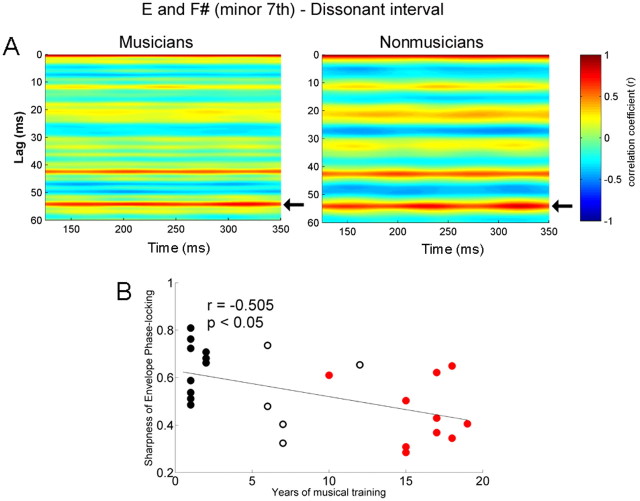
Figure 7.
A, Autocorrelograms of the response of musicians (left) and nonmusicians (right) for the dissonant interval. The time indicated on the x-axis refers to the midpoint of each 150 ms time bin analyzed. Color indicates the degree of periodicity. The band of color ∼54.1 ms (indicated by arrows) is sharper for the musicians and broader for nonmusicians. B, Sharpness of envelope phase locking for the dissonant interval as a function of years of musical training for all subjects (n = 26) including the amateur group. The longer an individual has been practicing music, the sharper the phase locking (i.e., narrower autocorrelation peak at 54.1 ms).

