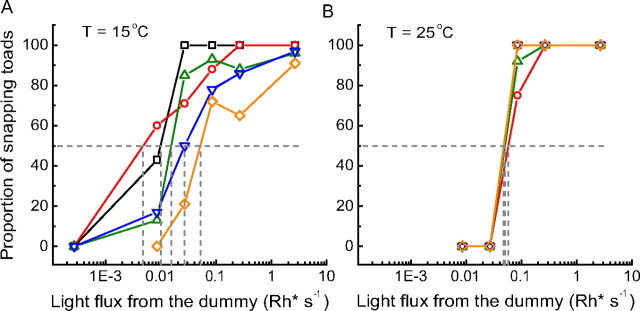
Figure 1.
Fraction of sessions in which toads snapped at least once toward the worm dummy plotted as function of light intensity at 15°C (A) and 25°C (B). Each symbol type and color represents results from experiments with one worm velocity: 0.9 mm/s (black squares), 3.1 mm/s (red circles), 4.5 mm/s (green upward triangles), 9.0 mm/s (blue downward triangles), and 13.8 mm/s (yellow diamonds).

