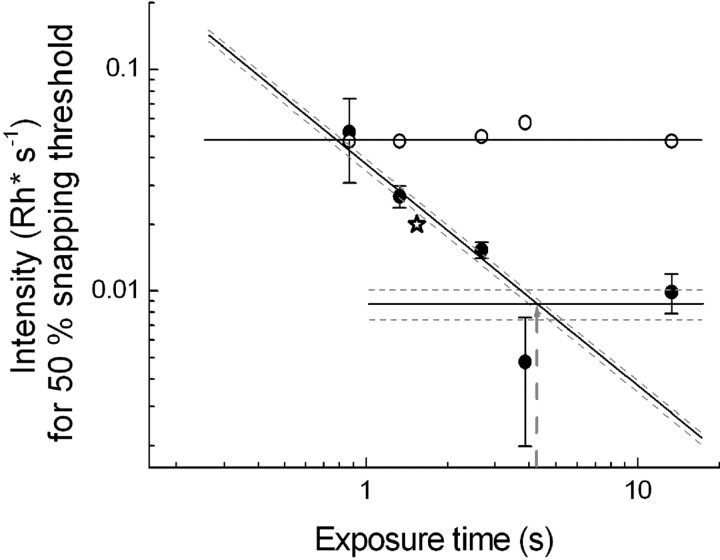
Figure 2.
Behavioral integration times estimated from the dependence of snapping thresholds on exposure time at 15°C (solid symbols) and 25°C (open symbols). A 45° straight line has been fitted by a least-squares criterion to the four 15°C data points (weighted in inverse proportion to the error bars) at which thresholds decrease with increasing exposure time. The intersection of this line and the horizontal straight line fitted by a least-squares criterion to the two lowest data points (weighted in inverse proportion to the error bars) gives the integration time at 15°C (shown by a gray dashed arrow). The dashed lines give SDs for the line fits, and taking the farthest intersection points of these as error limits, the 15°C integration time is 4.3 ± 0.9 s. The integration time at 25°C (open circles) is ≤0.87 s (i.e., at least fivefold shorter). The open star shows for comparison a threshold determined at 15°C with a 3 × 20 mm dummy moving at the speed 13.8 mm/s, indicating that the results are not sensitive to moderate changes in the spatial parameters of the stimulus.

