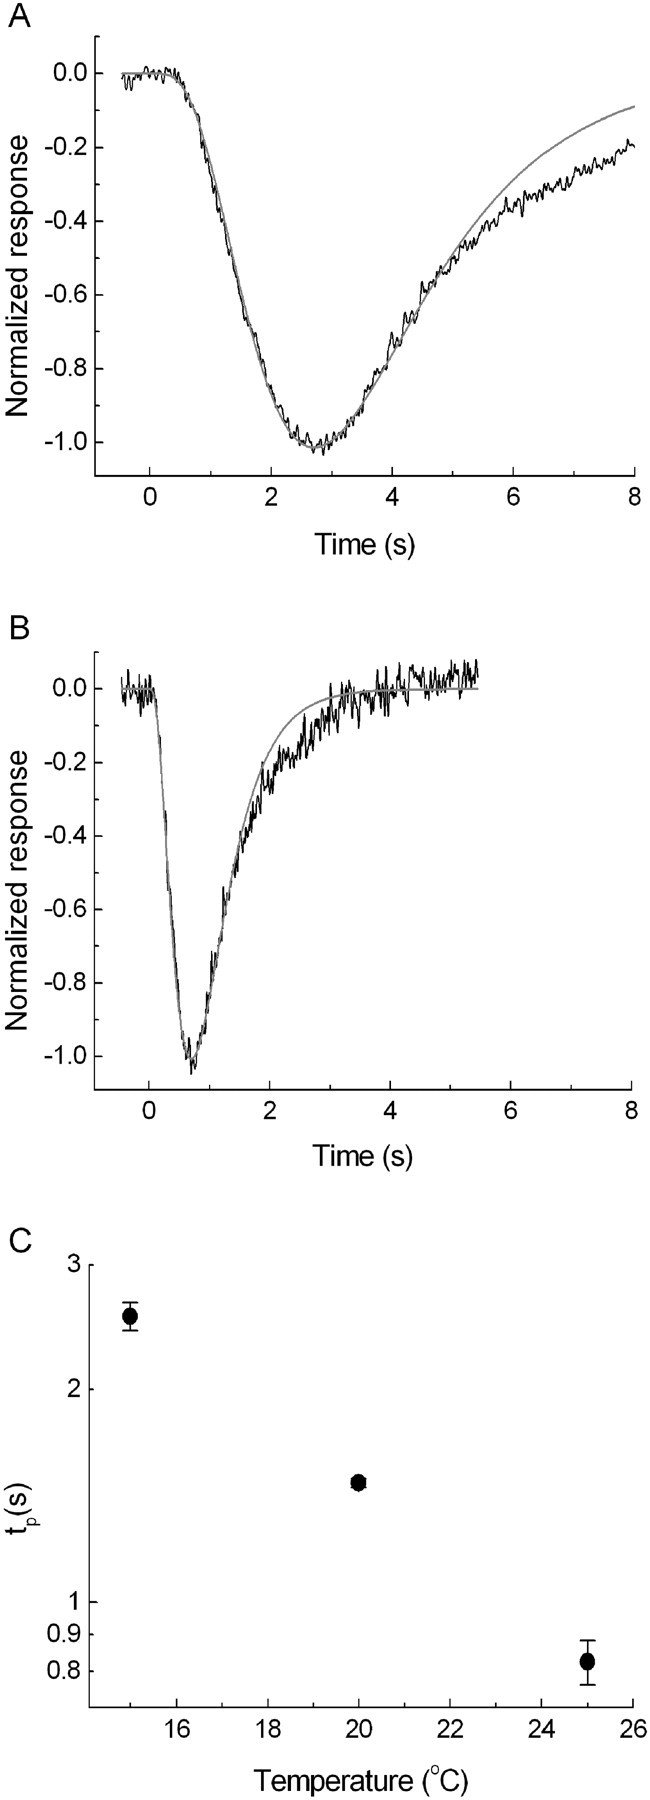
Figure 4.

Linear-range responses to brief light flashes at 15°C (A) and 25°C (B), normalized to unity at peak (the actual flash intensities were 7 Rh* and 15 Rh*, respectively). The responses have been fitted with the “independent activation” model of Baylor et al. (1974) with the number of filter stages n = 4 (gray curves). C, Times to peak of linear-range responses as function of temperature. The values are means of measurements in 10 retinas at 15°C, 4 at 20°C, and 10 at 25°C. Error bars indicate SEM.
