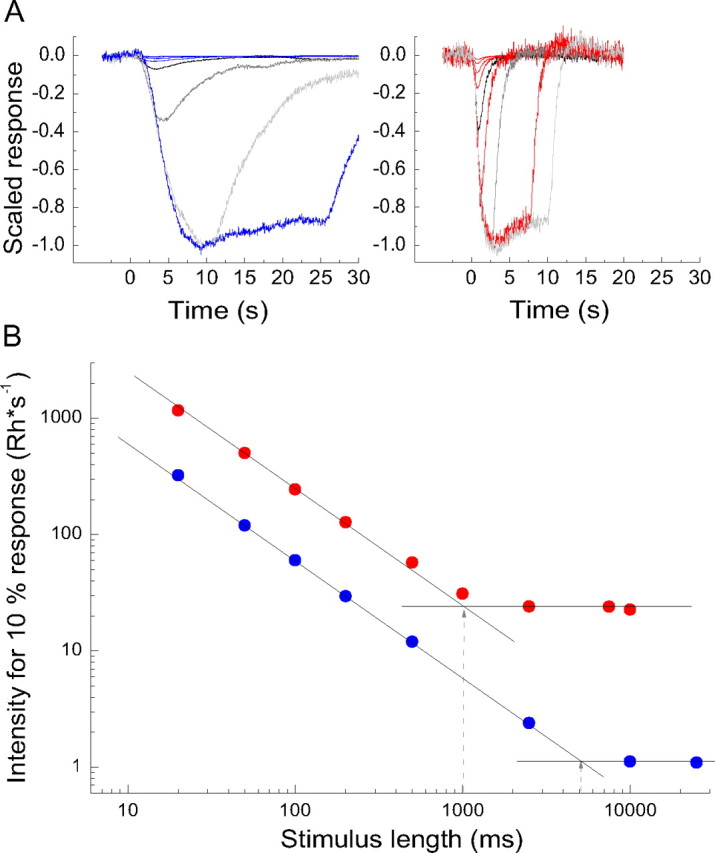
Figure 5.

A, Linear-range responses (averages of 3 single responses) to square-wave light pulses of different durations recorded at 15°C (left panel) and at 25°C (right panel). In the figure, the responses have been scaled by the inverse value of the stimulus intensity (Rh*s−1) used in each case and then normalized to unity peak amplitude of the largest response. The duration of the light pulse was 20, 50, 100, 200, 500 ms (black trace), 1000 ms (only at 25°C), 2500 ms (dark gray trace), 7500 ms (only at 25°C), 10,000 ms (light gray trace), and 25,000 ms (only at 15°C). B, Log light intensity (Rh*s−1) needed to evoke responses with peak amplitude of 10% of the saturated rod response amplitude, plotted as function of log pulse duration; data from the same retina as the responses in A. A 45° straight line has been fitted by a least-squares criterion to the red (25°C) and blue (15°C) data points for shorter pulse durations, at which thresholds decreased with increasing pulse length. The points of intersection of the 45° lines and the horizontal straight lines for each set of data (shown by gray dashed arrows) show the critical durations.
