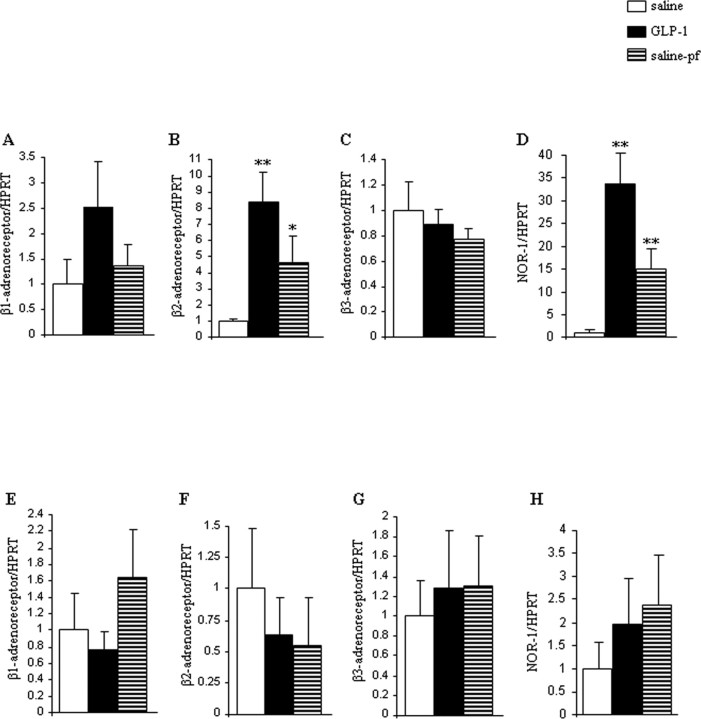
Figure 7.
A–D, Effect of a 2 d intracerebroventricular GLP-1 (0.75 nmol/d) infusion in lean mice on WAT mRNA expression of β1-AR (A), β2-AR (B), β3-AR (C), and NOR-1 (D). E–H, Effect of a 2 d intracerebroventricular GLP-1 (0.75 nmol/d) infusion in DIO mice on WAT mRNA expression of β1-AR (E), β2-AR (F), β3-AR (G), and NOR-1 (H). Data are presented as values normalized to HRPT, which was used as a housekeeping gene. mRNA levels are relative to controls. Values are mean ± SEM of 7–8 animals per group. **p < 0.01; *p < 0.05 versus saline.

