Figure 4.
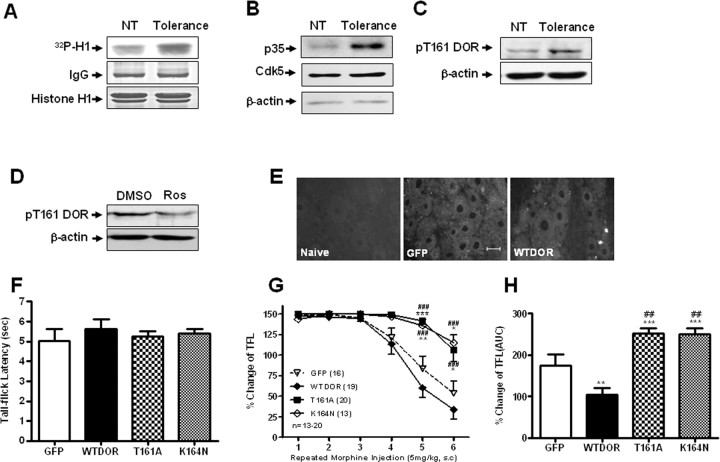
Cdk5 activity and Thr-161 phosphorylation of DOR are required for morphine antinociceptive tolerance. A, Representative Cdk5 kinase activity of DRG protein isolated from untreated rats (NT) or rats treated with morphine repeatedly (Tolerance), detected by an in vitro phosphorylation assay. Histone H1 was used as a substrate. B, Representative Western blot analysis of DRG protein isolated from rats treated with morphine repeatedly, blotted with p35 antibody. Total DRG lysates were immunoblotted with actin antibody as loading controls. C, Representative Western blot analysis of DRG protein isolated from untreated rats (NT) or rats treated with morphine repeatedly (Tolerance), blotted with pT161 DOR antibody. Total DRG lysates were immunoblotted with actin antibody as loading controls. NT, Nontreatment. D, Representative Western blot analysis of DRG protein isolated from rats treated with morphine repeatedly, pretreatment with DMSO or roscovitine, blotted with pT161 DOR antibody. Total DRG lysates were immunoblotted with actin antibody as loading controls. E, Green fluorescent signal was observed by fluorescent microscopy in primary sensory neurons 5 d after delivery of the indicated constructs. Scale bar, 20 μm. F, Exogenous expression of WT-DOR or the mutants T161A or K164N had no effect on basal nociceptive response in rats. G, The effect of intrathecal delivery of the indicated constructs on the development of morphine antinociceptive tolerance. Delivery of pEGFP-N3-T161A and pEGFP-N3-K164N resulted in markedly slower development of morphine antinociceptive tolerance compared with groups receiving pEGFP-N3-WT-DOR or pEGFP-N3 alone. The symbols represent means, and vertical lines represent SEM. *p < 0.05, **p < 0.01, ***p < 0.001, compared with EGFP group; ###p < 0.001, compared with WT-DOR group (n = 13–20). H, The bar graphs are expressed as a percentage of maximal area under the curve (AUC), which was calculated from the fifth morphine injection to the sixth morphine injection. The columns refer to means ± SEM. ***p < 0.001, **p < 0.01, compared with EGFP group; ##p < 0.01, compared with WT-DOR group (n = 13–20). All data were analyzed by ANOVA, followed by the Newman–Keuls multiple-comparison test.

