Figure 6.
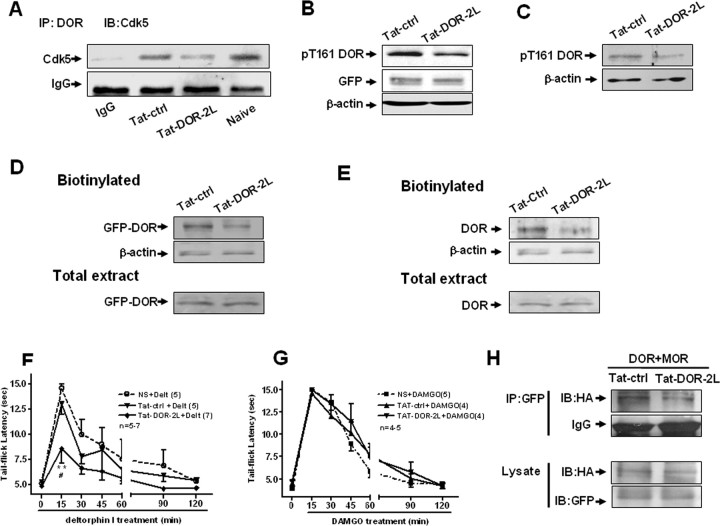
Tat-DOR-2L disrupts the coimmunoprecipitation of Cdk5 and DOR, the cell surface expression, and the formation of the DOR–MOR heterodimers. A, Reduced coimmunoprecipitation of Cdk5 and DOR after addition of Tat-DOR-2L, but not Tat-ctrl, into lysates before coimmunoprecipitation. B, Tat-DOR-2L reduces DOR Thr-161 phosphorylation. NG108-15 cells were transfected with GFP-DOR and treated for 4 h with the indicated drugs, and then immunoblotted with pT161 DOR antibody. Total cell lysates were immunoblotted with GFP and actin antibodies as a loading control. C, Tat-DOR-2L reduces DOR Thr-161 phosphorylation. Primary cultured DRG were treated for 4 h with the indicated drugs, and then immunoblotted with pT161 DOR antibody. Total cell lysates were immunoblotted with actin antibodies as loading controls. D, E, Cell surface biotinylation and Western blotting were performed in NG108-15 cells and primary cultured DRG neurons with indicated treatments to detect cell surface DOR level. D, Pretreatment of Tat-DOR-2L (3 μg/ml; 4 h) decreased DOR cell surface expression in NG108-15 cells transfected with EGFP-DOR, compared with cells pretreated with Tat-ctrl. Total extract represents the total expression level. E, Tat-DOR-2L pretreatment (3 μg/ml; 4 h) decreased endogenous DOR cell surface expression in primary cultured DRG neurons compared with Tat-ctrl pretreatment. Total extract represents the total expression level. NT, Nontreatment. F, Intrathecal pretreatment of Tat-DOR-2L (3 μg) for 30 min disrupted the antinociceptive effect induced by intrathecal injection of deltorphin I (10 μg). Each point represents the mean, and vertical bars represent the SEM. **p < 0.01, compared with NS group; #p < 0.05, compared with Tat-ctrl group (n = 5–7). G, Intrathecal pretreatment with Tat-DOR-2L (3 μg) for 30 min did not disrupt the antinociceptive effect induced by intrathecal injection of DAMGO (1 nmol). Each point represents the mean, and vertical bar represents the SEM (n = 4–5). Data were analyzed by ANOVA, followed by the Newman–Keuls multiple-comparison test to test the difference between groups. H, Cell lysates from NG108-15 cells cotransfected with EGFP-DOR (2 μg), HA-MOR (4 μg) cDNA were pretreated by Tat-DOR-2L/Tat-ctrl (3 μg/ml), and then were subjected to immunoprecipitation using polyclonal anti-GFP antibody, and associated HA-MOR was detected by immunoblotting using a monoclonal anti-HA antibody. Level of DOR and MOR under each transfection condition is shown by immunoblotting with anti-GFP and anti-HA antibody, respectively.

