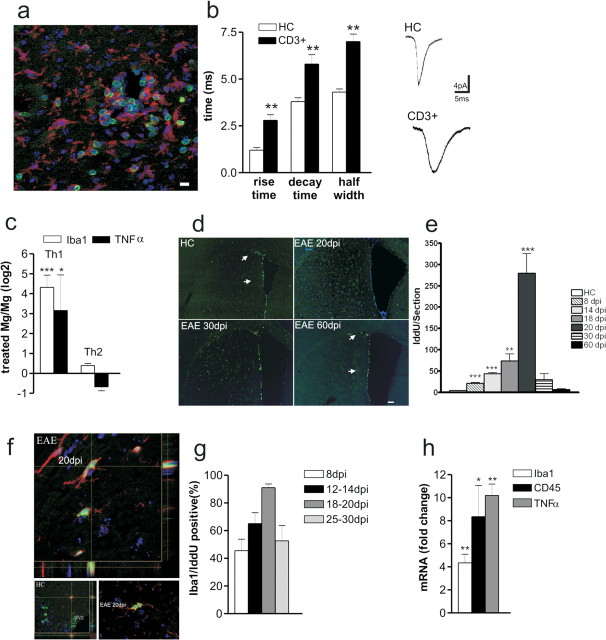
Figure 2.
T lymphocytes alter synaptic transmission and cause microglia/macrophage activation in EAE. a, Inflammatory lesions in the striatum of EAE mice (20 dpi) were evaluated by double staining for CD3 (green in the box) or Iba1 (red in the box). b, The histogram shows that both rise and decay time of sEPSCs recorded from neurons in the presence of CD3+ cells were altered. The electrophysiological traces on the right are examples of sEPSC mean peak obtained by group analysis in control conditions (CD3+ cells from healthy controls) and in the presence of CD3+ cells extracted from EAE mice. **p < 0.01. c, Primary microglial cell cultures were generated starting from P2 C57BL/6 newborn. Primary microglia cells were shaken off and treated with either the Th1 or the Th2 mix for 24 h (n = 3 independent cell cultures). Then, total mRNA was extracted and used for the real-time PCR analysis. The histogram shows that Th1 mix treatment resulted in a dramatic upregulation of either Iba1 (4.3 ± 0.6; ***p < 0.001) or TNFα (3.15 ± 1.7; *p < 0.05) mRNA levels, markers of microglia/macrophage cell activation. Data represent the log2 of the fold changes (±SEM) with respect to the vehicle-treated cells. d, Striatal sections from HC and EAE mice (20, 30, and 60 dpi) were probed for IddU detection during 10 h of IddU administration. IddU+ cells (green) were distributed within either the dorsolateral or ventrolateral SVZ in both HC and EAE 60 dpi (arrows in first and fourth panels). However, EAE 20 dpi showed many IddU+ cells located within the striatal parenchyma (second panel). This phenotype was reduced at later time points as shown at either EAE 30 or 60 dpi. Scale bar, 150 μm. e, The mean ± SEM number of IddU+ cells were counted at each time point and plotted on histogram. ***p < 0.001. f, g, Cell counts revealed a mean number per section of 20 ± 2 (p < 0.0001) IddU+ cells at 8 dpi, 47 ± 2 (p < 0.0001) IddU+ cells at 14 dpi, 73 ± 16 (p < 0.01) IddU+ cells at 18 dpi, 280 ± 45 (p < 0.001) IddU+ cells at 20 dpi, 30 ± 14 (NS) IddU+ cells at 30 dpi, and 7 ± 2 (NS) IddU+ cells at 60 dpi. f, Confocal optical sections of parallel sections probed for Iba1 (red) and IddU (green) detection revealed that 45 ± 8% of the proliferating cells were Iba1+ at 8 dpi, 65 ± 8% of the proliferating cells were Iba1+ at either 12 or 14 dpi, 91 ± 3% of the proliferating cells were Iba1+ at either at 18 or 20 dpi, and 68 ± 11% of the proliferating cells were Iba1+ at either 25 or 30 dpi. Scale bar, 10 μm. h, Histogram showed mRNA fold changes ± SEM for Iba1 (4.3 ± 0.7; p < 0.01), CD45 (8.3 ± 2.7; p < 0.05), and TNFα (10.22 ± 0.9; p < 0.01). Total RNA was extracted from laser-captured microdissection of striatum, respectively, from HC and EAE 20 dpi brains and then used for quantitative real-time PCR. *p < 0.05; **p < 0.01.

