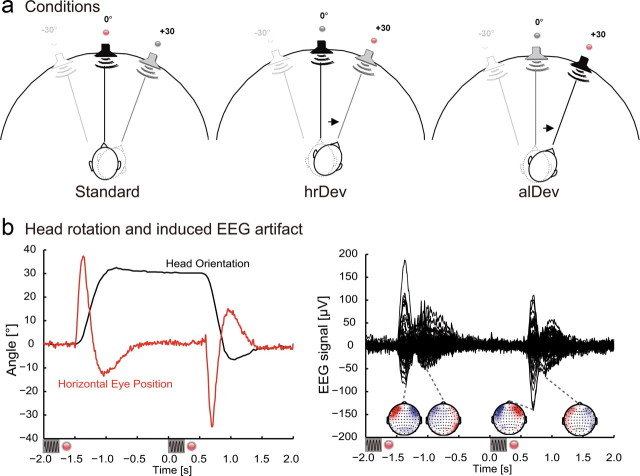
Figure 1.
a, Experimental setup of LEDs and sound source positions for an exemplary run (mid→right). The left figure depicts the standard condition: in this case, standard stimulation entailed a series of noise sounds presented from the central position (in black). The subject's head orientation was cued by the red LED. The central figure depicts the head-related deviant (hrDev): before sound presentation from a central position (in black), subjects were cued to rotate their head to the right (indicated by the arrow). The right figure depicts the allocentric deviant condition (alDev): subjects were cued to rotate their head to the right, but this time the noise sound was presented at the right sound source position (in black). b, Typical artifact (single trial from an exemplary subject) elicited during head rotation from −2 to +2 s after deviant onset. The left graph shows the horizontal head orientation recorded continuously at 30 Hz and eye-in-head position. The small black sine waves below the graphs depict sound stimulation, the red dots symbolize LED cue change. The right graph shows the evoked EEG response during the head turn. Below are the EEG topographies at the time points indicated by the gray dashed lines (extrema of the EEG response).

