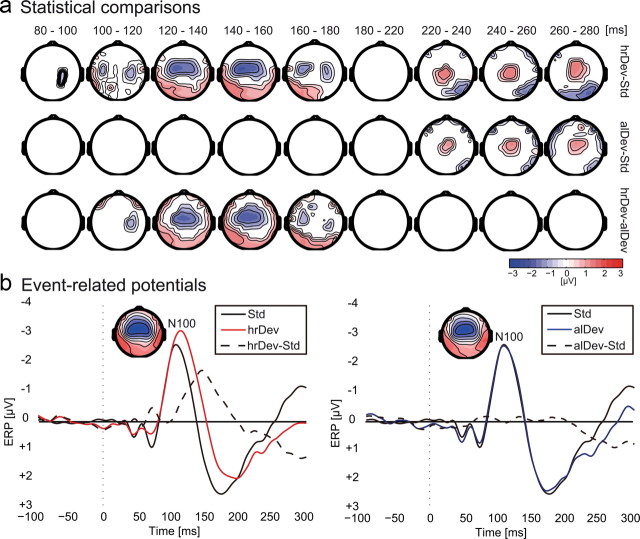
Figure 2.
EEG data. a, Statistical comparisons across conditions based on a nonparametric cluster–randomization procedure. Only difference data from electrodes are shown that were part of a significant cluster (p < 0.05 cluster level) throughout the indicated period. The top row shows significant differences between the hrDev and the standard (Std). The center row depicts significant differences between the alDev and the standard condition, and the bottom row shows significant differences between the two deviant conditions. b, EEG time courses from fronto-central electrodes to compare the ERPs to the head-related deviant (red line), the allocentric deviant (red line), and the standard (black line, both graphs). The dashed black line depicts the difference wave between conditions. The topographies show the deviant N100 event-related potential in the time window between 90 and 110 ms for the two deviant conditions.

