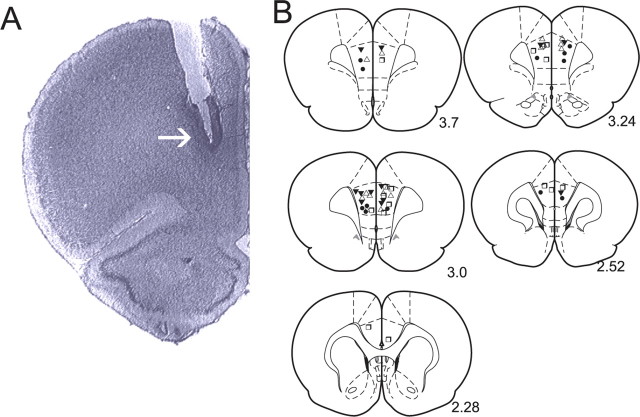
Figure 1.
Histological analysis of intra-mPFC microinjection sites. A, Microphotograph of a representative injector placement within the mPFC. B, Schematic illustration showing representative bilateral placements of microinjection cannulae. For illustrative clarity, only a subset of experimental groups is presented. Symbols represent separate experimental groups: ▵, PD 168077, 50 ng/0.5 μl versus acquisition of subthreshold stimuli; □, SKF 38393, 1000 ng/0.5 μl versus acquisition of subthreshold stimuli; ▾, PD 168077, 50 ng/0.5 μl versus acquisition of suprathreshold stimuli; •, SKF 38393, 1000 ng/0.5 μl versus expression of suprathreshold stimuli.

