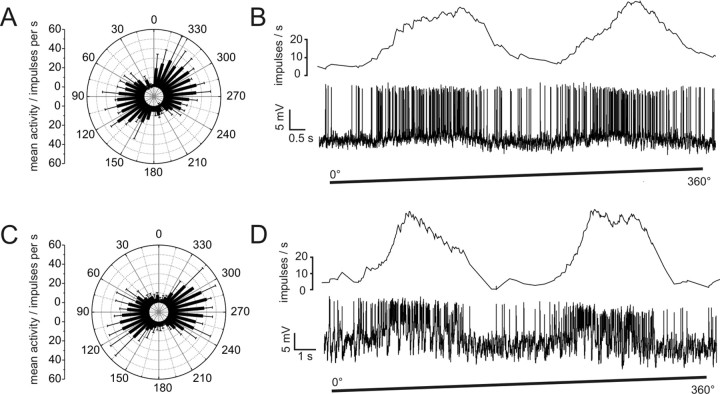
Figure 2.
Responses of CL1a and CL1b/d neurons to polarized light. A, Circular diagram of mean frequencies of action potentials of a CL1a neuron plotted against E-vector orientation during dorsal stimulation with a rotating polarizer (n = 2, error bars = SD, bin size 10°, p < 10−12). B, Spike train (lower trace) and mean spiking frequency (upper trace, gliding average with bin size of 1 s) of the same neuron during a clockwise 360° rotation of the polarizer. C, Mean activity of a double-labeled CL1b/d neuron from four 360° rotations of the polarizer (error bars, SD; bin size 10°; p < 10−12). D, Spike train and mean spiking frequency from the same neuron as in C during a clockwise 360° rotation of the polarizer. Postsynaptic potentials are visible throughout the recording.

