
Figure 5.
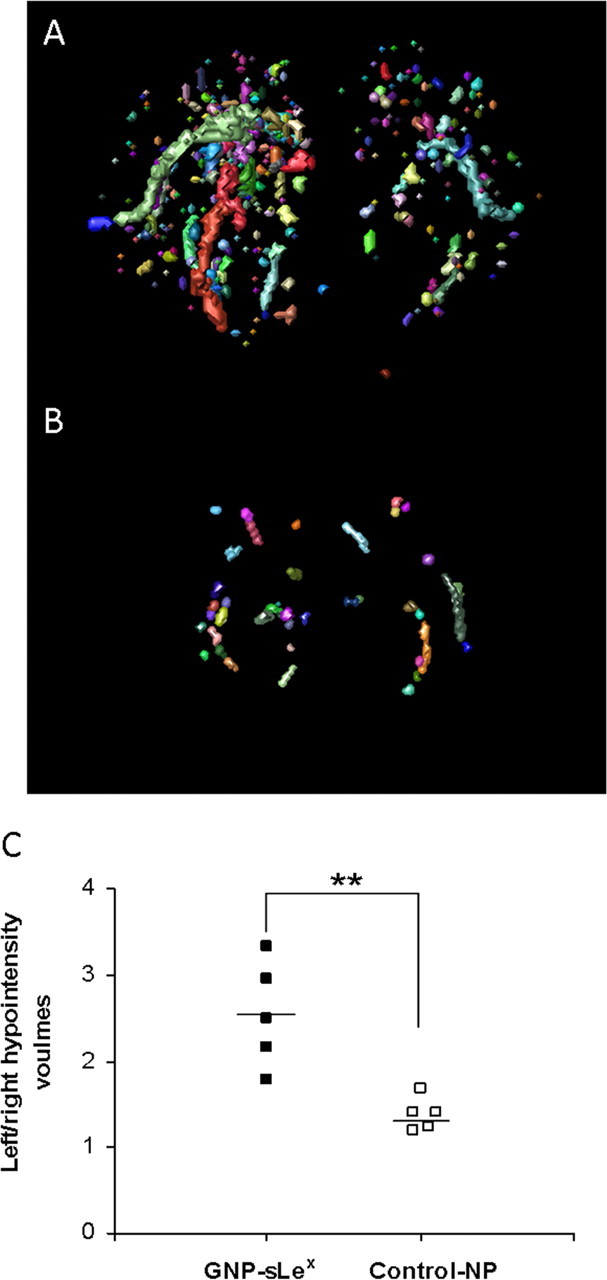
3D reconstruction maps revealing E- and P-selectin expression (automatic color volumes) in fMOG-EAE animals 28 d after intracerebral injection of cytokine injected with either GNP-sLex (A) or nonfunctionalized control-NP (B). C, Graph showing quantitative analysis of iron oxide nanoparticle accumulation, given as relative volume (left/right) of T2* hypointensities, in GNP-sLex-injected (■; n = 5) and control-NP-injected (□; n = 5) animals (**p < 0.01).