
Figure 6.
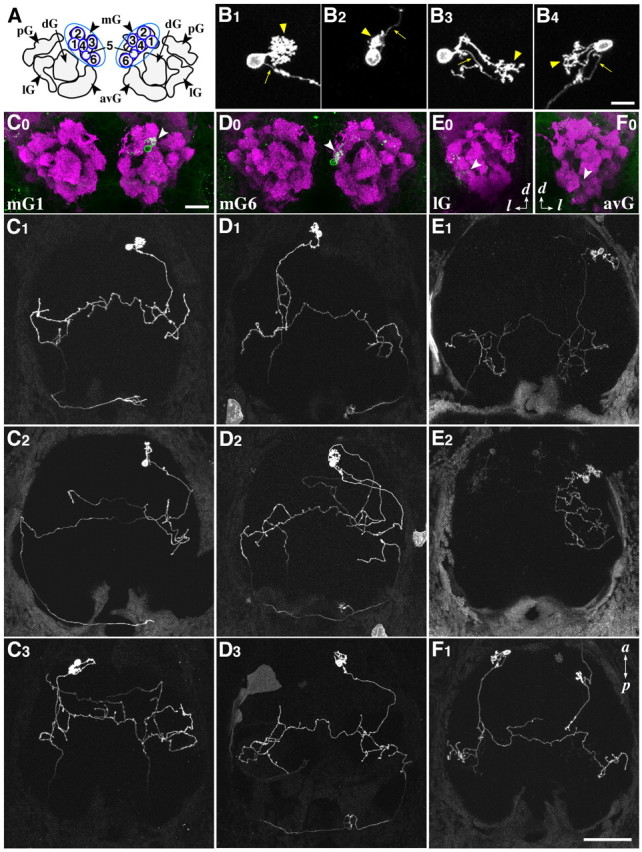
Genetic visualization of single mitral cells. B–F, Single-cell labeling was performed by injecting a mixture of two plasmids, plhx2a:GAL4-VP16-S and pUAS:gap-YFP (B1–B3, C–E), or ptbr2a:GAL4-VP16 and pUAS:gap-YFP (B4, F), into 1–4 cell-stage embryos. The dendritic innervation pattern and the axon trajectory were examined at 7 dpf. A, Schematic representation of OB glomerular clusters and mG numbering. B1–B4, Typical dendritic morphologies of labeled MCs. Arrows and arrowheads denote the axons and the dendritic tufts, respectively. C0–F0, Examples of glomerular innervation patterns of four MC classes. C1–C3, Axon projection patterns of mG1–MCs in three different larvae. D1–D3, Axon projection patterns of mG6–MCs in three different larvae. E1, E2, Axon projection patterns of lG–MCs in two different larvae. F1, An axon projection pattern of avG-MC in a larva. C0–F0, Frontal views with dorsal to the top. C1–F1, Dorsal views with anterior to the top. a, Anterior; p, posterior; d, dorsal; l, lateral. Scale bar: (in B4) B1–B4, 10 μm; (in C0) C0–F0, 20 μm; (in F1), C1–F1, 50 μm.