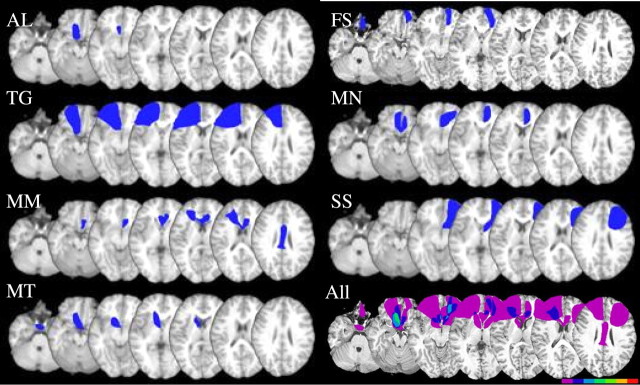
Figure 1.
Lesion locations of 7 of the 8 ACoA patients drawn from clinical CTs and superimposed on a template MRI scan. The last image (All) shows lesion overlap across patients, with the color bar reflecting the number of patients with overlapping lesions at a particular location. Color bar for the bottom right figure represents the number of patients whose lesion overlaps at a particular location with a minimum of one (purple) to a maximum of seven (red). The image was created using MRIcro software (Chris Rorden; www.psychology.nottingham.ac.uk/staff/cr1/mricro.html).

