
Figure 5.
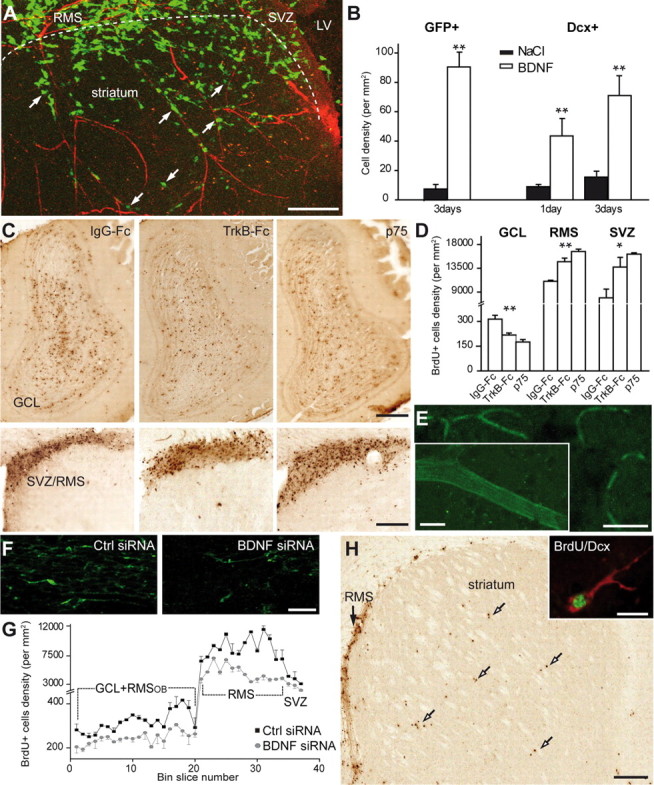
BDNF induces vasculature-associated cell migration in the adult forebrain. A, Micrographs illustrating migration of GFP+ neuroblasts into the striatum 3 d after stereotaxic injection of BDNF (100 ng) to this region. GFP-expressing retrovirus was injected into the SVZ 2 d before injection of BDNF. Note that numerous migrating neuroblasts (arrows) use blood vessels for their navigation into the striatum. LV, Lateral ventricle. Scale bar, 100 μm. B, Quantification of the density of GFP+ and Dcx+ derouted cells in the striatum. C, Micrographs showing BrdU+ cells in the OB and SVZ/RMS 7 d after osmotic minipump infusions of IgG–Fc (10–90 μg/ml), TrkB–Fc (10 μg/ml), and p75NTR function-blocking antibodies (90 μg/ml) just above horizontal limb of the RMS. BrdU was injected 2 d before osmotic minipump installation. Note the reduced number of BrdU+ cells in the OB and increased number in the SVZ/RMS of TrkB–Fc and p75NTR function-blocking antibody infused animals. Scale bar, 100 μm. D, Density of BrdU+ cells in the granule cell layer (GCL) of the OB, RMS, and SVZ of IgG–Fc, TrkB–Fc, and p75NTR function-blocking antibody infused animals. E, Labeling of blood vessels after osmotic minipump infusion of fluorescently tagged BDNF siRNA to the carotid artery. Control and BDNF siRNAs were infused for 7 d. Inset shows high-magnification image of fluorescently tagged siRNA-labeled blood vessel. Scale bars: E, 50 μm; inset, 10 μm. F, Immunostaining for BDNF in the control and BDNF siRNAs-treated animals. Note the reduced intensity of immunostaining. Scale bar, 20 μm. G, Density of BrdU+ cells in the SVZ–OB pathway after control (black squares) and BDNF (gray squares) siRNA infusion to the carotid artery. Single pulse of BrdU was given 6 h before installation of osmotic minipumps. BrdU+ cells were counted in the coronal sections spaced by 120 μm throughout the SVZ–OB pathway. H, Micrographs displaying BrdU+ cells in the RMS of BDNF siRNA-treated animals. Note that numerous BrdU+ cells (arrows) leave RMS and migrate to the striatum. Inset shows high-magnification image of BrdU (green) and Dcx (red) colabeled cell in the striatum. Scale bars: H, 100 μm; inset, 10 μm.