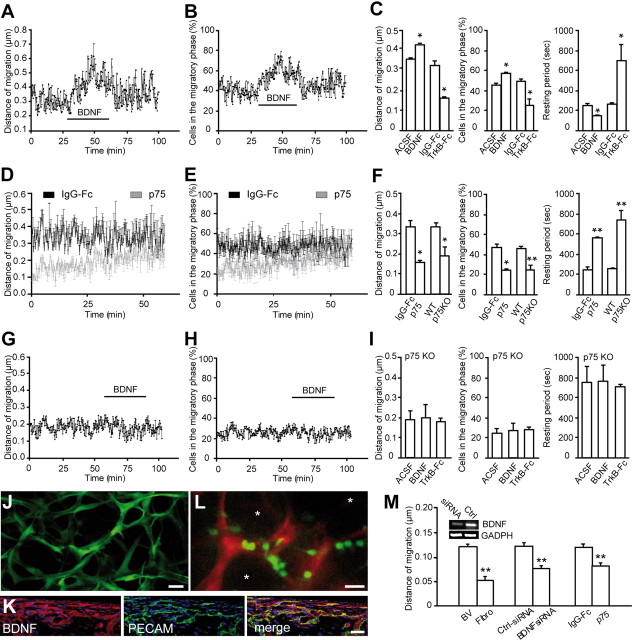
Figure 6.
BDNF fosters neuronal migration via p75NTR. A, B, Individual experiment demonstrating that bath application of BDNF (10 ng/ml) increases the average distance that migrating cells propagate (A) and raises the percentage of cells that are in the migratory phase at each time point (B). The time period for BDNF application is shown by a black line. C, Summary graph showing the effect of BDNF or TrkB–Fc (1 μg/ml) applications on the average distance that migratory cells propagate (per 15 s), the percentage of cells in the migratory phase, and the duration of the stationary period. In control experiments, IgG–Fc (1 μg/ml) was applied instead of TrkB–Fc. D, E, Summary graphs showing that preincubation of slices with p75NTR function-blocking antibodies drastically decreases the average distance that migrating cells propagate (D) and reduces percentage of cells in the migratory phase at each time point (E). The time-lapse recording was performed after preincubation of slices in either p75NTR function-blocking antibodies or IgG–Fc (20 μg/ml) for 1 h. During the entire period of recording, the slices were continuously perfused with oxygenated ACSF (2 ml/min). Note that the blocking effect of p75NTR function-blocking antibodies is washed out during recording. F, Summary graph showing that deficiency in p75NTR and application of p75NTR function-blocking antibodies affects the average distance that migratory cells propagate (per 15 s), the percentage of cells in the migratory phase, and the duration of the stationary period. G, H, Individual experiment demonstrating that bath application of BDNF (10 ng/ml) does not affect the average distance that migrating cells propagate (G) and the percentage of cells in the migratory phase at each time point (H) in the slices prepared from p75NTR-deficient animals. I, Summary graph showing the absence of effect of BDNF and TrkB–Fc applications on the average distance that migratory cells propagate (per 15 s), the percentage of cells in the migratory phase, and the stationary period duration in p75NTR-deficient animals. J, Micrograph illustrating GFP+ tissue-engineered 3D capillary-like network in vitro. Scale bar, 30 μm. K, Immunostaining for BDNF (red) and PECAM (green) in the transversal sections of sponges containing capillary-like network. Scale bar, 50 μm. L, Micrograph depicting GAD67–GFP+ neuroblasts (green) cocultured in 3D capillary-like network (red). HUVEC cells were transduced with GFP lentivirus. GFP+ neuroblasts (small cells of ∼5–10 μm size) and GFP+ capillaries (long tubular-like structures) were easily distinguishable on the basis of their shapes and were false-colored in offline analysis using ImagePro software. Note that neuroblasts accumulate along the capillaries, and places that do not contain these capillary-like structures (asterisks) are also free of neuroblasts. Scale bar, 20 μm. M, Quantification of neuroblast migration in the capillary-like network under different experimental conditions. Note the increased migration of neuronal precursors in the cultures containing capillary-like structure compared with the control fibroblast containing cultures (Fibro). Note also that BDNF siRNA and p75NTR function-blocking antibodies reduce the migration of neuronal precursors. Distance of migration (per 15 s) was calculated in the images acquired every 15 s for at least 1 h. Inset shows semiquantitative RT-PCR analysis of BDNF expression in the endothelial cells after siRNA transfection. KO, Knock-out; WT, wild type; BV, blood vessels.

