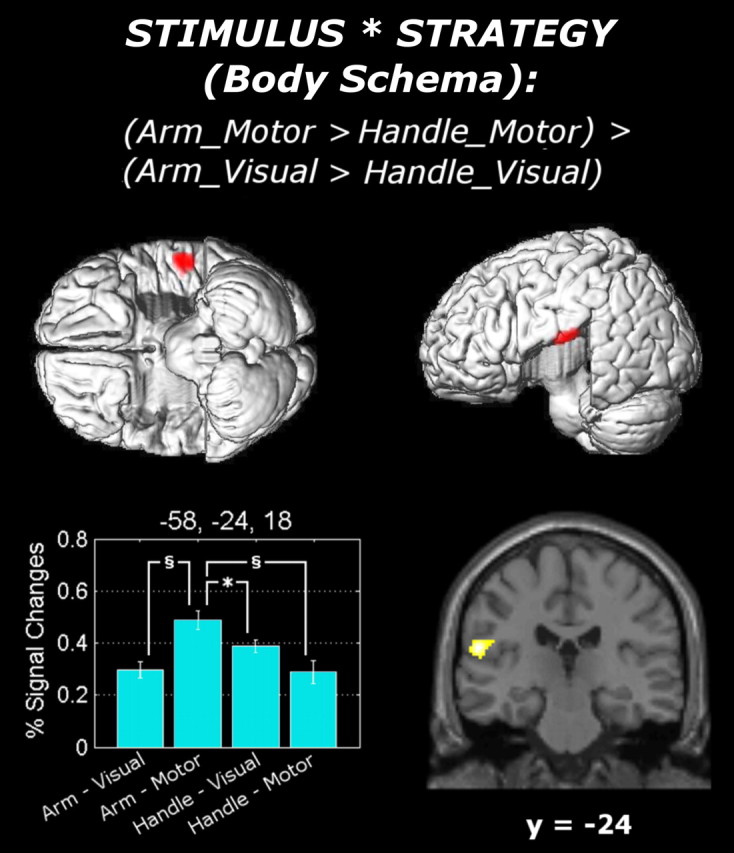
Figure 4.

Surface rendering and coronal (y = −24) section of the functional contrast testing the stimulus × strategy interaction. The surface rendering was obtained from an MNI-normalized single-subject brain in which the temporal lobes were removed, thus allowing free vision of the surface of the parietal operculum. The percentage signal changes associated with the activated area (local maxima: −56, −24, 18) are displayed together with SEM bars. The results of the paired t tests performed over the extracted percentage signal changes are also displayed within the bar graph [§t(16) > 2.92 (corresponding to p < 0.01); *t(16) > 2.12 (corresponding to p < 0.05)].
