
Figure 5.
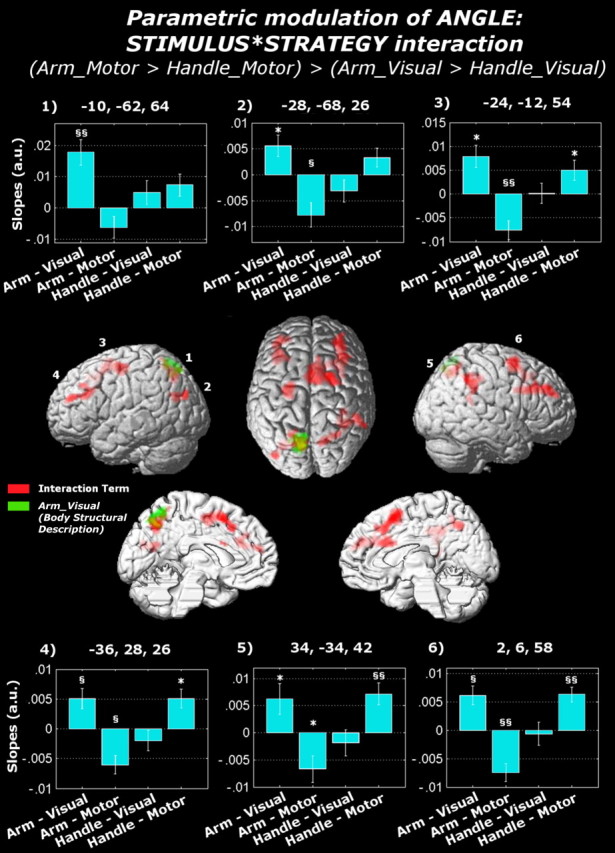
Analysis of the parameters estimating, for each condition, the linear relation between BOLD response and angle. Surface rendering of the functional contrast testing (1) the stimulus × strategy interaction (displayed in red) and (2) the simple effect of assessing the arm's laterality when using the visual strategy (displayed in green). The linear relationship between BOLD response and angle for each activated region is displayed with SEM bars: positive values refer to BOLD responses increasing with the angles at which the stimuli are rotated, whereas negative values refer to BOLD responses decreasing with the angles at which the stimuli are rotated. The results of the one-sample t tests performed over the extracted parameters are also displayed within the bar graph [§§t(16) > 4.01 (corresponding to p < 0.001); §t(16) > 2.92 (corresponding to p < 0.01); *t(16) > 2.12 (corresponding to p < 0.05)]. Bars without any symbol indicate nonsignificant effects.